Guest blog post by Anna Filippova, Connor Gilroy, and Antje Kirchner
In this post, we discuss the challenges of preparing the Fragile Families data for modeling, as well as the rationales for the methods we chose to address them. Our code is open source, and we hope other Challenge participants find it a helpful starting point.
If you want to dive straight into the code, start with the vignette here.
Data processing
The people who collect and maintain the Fragile Families data have years of expertise in understanding the data set. As participants in the Fragile Families Challenge, we had to use simplifying heuristics to get a grasp on the data quickly, and to transform as much of it as possible into a form suitable for modeling.
A critical step is to identify different variables types, or levels of measurement. This matters because most statistical modeling software transforms categorical covariates into a series of k – 1 binary variables, while leaving continuous variables untransformed. Because categorical variables are stored as integers, with associated strings as labels, a researcher could just use those integers directly in a model instead—but there is no guarantee that they would be substantively meaningful. For interpretation, and potentially for predictive performance, accounting for variable type is important.
This seems like a straightforward problem. After all, it is typically clear whether a given variable is categorical or continuous from the description in the codebook. With a handful of variables, classifying them manually is a trivial task, but this is impossible with over 12,000 variables. An automated solution that works well for the majority of variables is to leverage properties of the Stata labels, using haven, to convert each variable into the appropriate R class—factor for categorical variables, numeric for continuous. We previously released the results of this work as metadata, and here we put it to use.
A second problem similarly arises from the large number of variables in the Fragile Families data. While some machine learning models can deal with many more parameters than observations (p >> n), or with high amounts of collinearity among covariates, most imputation and modeling methods run faster and more successfully with fewer covariates. Particularly when demonstrating or experimenting with different modeling approaches, it’s best to start out with a smaller set of variables. If the constructed variables represent expert researchers’ best attempts to summarize, consolidate, and standardize survey responses across waves, then those variables make a logical starting point. Fortunately, most of these variables can be identified with a simple regular expression.
Finally, to prepare for imputation, Stata-style missing values (labelled negative numbers) need to be converted to R-style NAs.
Missing data
Data may be missing in a (panel) study for many reasons, including respondent’s unwillingness to answer a question, a don’t know response, skip logic (for questions that do not apply to a given respondent), and panel attrition (for example, due to locating difficulties for families). Additional missing data might be due to data entry errors and—particularly relevant for the challenge—anonymization to protect sensitive information of members of a particularly vulnerable population.
What makes missing data such a challenge for computational approaches? Many statistical algorithms operate on complete data, often obtained through listwise deletion of cases. This effectively assumes that instances are missing completely at random. The Fragile Families data are not missing completely at random; moreover, the sheer amount of missingness would leave few cases remaining after listwise deletion. We would expect a naive approach to missingness to significantly reduce the predictive power of any statistical model.
Therefore, a better approach is to impute the missing data, that is, make a reasonable guess about what the missing values could have been. However, current approaches to data imputation have some limitations in the context of the Fragile Families data:
- Standard packages like Amelia perform multiple imputation from a multivariate normal distribution, hence they are unable to work on the full set of 12,000 covariates with only 4,000 observations This is also computationally intensive, taking several hours to run even when using a regularizing prior, a subset of variables, and running individual imputations in parallel.
- Another promising approach would be to use Full Information Maximum Likelihood estimation. FIML estimation models sparse data without the need for imputation, thus offering better performance. However, no open-source implementation for predictive modeling with FIML exists at present.
- We could also use the existing structure of the data to make logical edits. For instance, if we know a mother’s age in one wave, we can extrapolate this to subsequent waves if those values are missing. Carrying this idea a step further, we can make simple model-based inferences; if, for example, a father’s age is missing entirely, we can impute this from the distribution of differences between mother’s and father’s ages. This process, however, requires treating each variable individually.
To address some of these issues, our approach to missing data considers each variable in the data-set in isolation (for example cm1hhinc, mother’s reported household income at wave 1), and attempts to automatically identify other variables in the data-set that may be strongly associated with this variable (such as cm2hhinc, mother’s reported household income at wave 2 and cf1hhinc, father’s reported household income at wave 1). Assembling a set of 3 to 5 of such associations per variable allows us to construct a simple multiple-regression model to predict the possible value of the missing data for each column (variable) of interest.
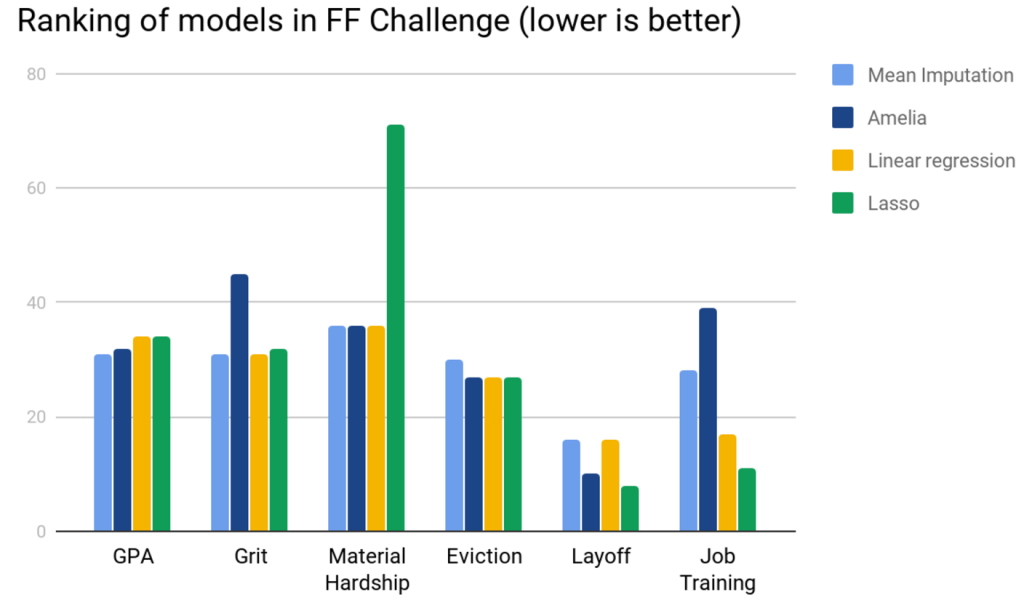
Our approach draws on two forms of multiple-regression models, a simple linear ordinary-least squares regression, and a linear regression with lasso penalization. To evaluate their performance, we compare our approach to two alternative forms of imputation: a naive mean-based imputation, and imputation using the Amelia package. Holding constant the method we use to make predictions and the variables used, our regression-based approach outperforms mean imputation on the 3 categorical outcome variables: Eviction, Layoff, and Job Training. The Lasso imputation also outperforms Amelia on these variables, but the unpenalized regression imputation has mixed effects. Interestingly, mean imputation performs the best for GPA and Grit, and we saw a similar performance on Material Hardship using mean imputation, Amelia, and linear regression, but Lasso was significantly worse than the former approaches. Overall, even simple mean imputation performed better than using Amelia on this dataset.
The approach we used comes with a number of assumptions:
- We assume that the best predictors of any given variable already exist in the Fragile Families dataset, and do not need significant processing. This is not an unreasonable assumption, as many variables in the dataset are collected across different waves, thus there may be predictable relationships between each wave.
- Our tests above assume a linear relationship between predictor variables and the variable we impute, although our code has an option to also take into account polynomial effects (the ‘degree’ option available when using method=’lasso’).
- To get complete predictions for all 4000 cases using the regression models, we needed to first impute means of the covariates used for the imputation. In other words, in order to fill in missing data, we paradoxically needed to first fill in missing data. FIML is one solution to this challenge, and we hope to see this make its way into predictive modelling approaches in languages like R or Python.
Our pipeline
We modularized our work into two separate repositories, following the division of labor described above.
For general data processing, ffc-data-processing, which
- Works from the background.dta Stata file to extract covariate information.
- Provides helper functions for relatively fast data transformation.
For missing data imputation, FFCRegressionImputation, which
- Prepares the raw background.csv data and performs a logical imputation of age-related variables as we describe above.
- Constructs a (correlation) matrix of strengths of relationships between a set of variables.
- Uses the matrix to perform a regression-based prediction to impute the likely value of a missing entry.
For a technical overview of how these two bodies of code integrate with each other, check out the integration vignette. The vignette is an RMarkdown file which can be run as-is or freely modified.
The code in the vignette subsets to constructed variables, identifies those variables as either categorical or continuous, and then only imputes missing values for the continuous variables, using regression-based imputation. We chose to restrict the variables imputed for illustrative purposes, and to improve the runtime of the vignette. Users of the code can and should employ some sort of imputation strategy—regression-based or otherwise—for the categorical variables before incorporating the covariates into a predictive model.
Reflections
What seemed at the beginning to be a straightforward precursor to building predictive models turned out to have complexities and challenges of its own!
From our collaboration with others, it emerged that researchers from different fields perceive data problems very differently. A problem that might not seem important to a machine-learning researcher might strike a survey methodologist as critical to address. This kind of cross-disciplinary communication about expectations and challenges was productive and eye-opening.
In addition, the three of us came into this project with very different skillsets. We settled on R as a lingua franca, but drew on a much broader set of tools and techniques to tackle the problems posed by the Fragile Families Challenge. We would encourage researchers to explore all the programming tools at their disposal, from Stata to Python and beyond.
Finally, linking everyone’s efforts together into a single working pipeline that can be run end-to-end was a significant step by itself. Even with close communication, it took a great deal of creativity as well as clarity about desired inputs and outputs.
We hope that other participants in the Fragile Families Challenge find our tools and recommendations useful. We look forward to seeing how you can build on them!