Author matt-salganik

Author matt-salganik

Update about Fragile Families Challenge community paper

Uncategorized No comments

We recently published a correction about the community paper from the Fragile Families Challenge (https://www.pnas.org/content/118/50/e2118703118).  In brief, when we published our paper, we also posted our code on Dataverse (https://doi.org/10.7910/DVN/CXSECU), consistent with open science practices.  Subsequently, one research team—Charles Rahal and Mark Verhagen—contacted us about a possible bug in our code.  We have investigated this report carefully, and we agree that there was a bug in our code.  While investigating this bug, we found two other unrelated issues.  In the end, however, none of these issues impacted the conclusions of the article in any way.

In addition to publishing the correction, we have updated our replication materials and alerted any researchers we know who are working with the replication materials.  If you are working with these replication materials, we recommend you use the updated version.  We’d be happy to answer any questions about them.

“Prediction, Machine Learning, and Individual Lives: An Interview with Matthew Salganik” published in Harvard Data Science Review

Uncategorized No comments
An interview with Challenge co-organizer Matthew Salganik, conducted by Lauren Maffeo and Cynthia Rudin, was just published in the Harvard Data Science Review.  The piece—“Prediction, Machine Learning, and Individual Lives: An Interview with Matthew Salganik”—covers the Fragile Families Challenge and its implications for scientists and policy makers.

Publication of paper and Socius Special Collection

Uncategorized No comments

We are happy to (belatedly) announce the publication of both a paper about the Fragile Families Challenge with 112 authors in the Proceedings of the National Academy of Sciences and the Socius Special Collection.

Here are some links:

reaching out to all participants in the Fragile Families Challenge

Uncategorized No comments

We are in the process of writing the community paper that describes the results of the Fragile Families Challenge, and we have attempted to email all participants in the Challenge. If you participated in the Challenge but have not received an email from us (perhaps because your email address has changed), please contact us by Wednesday, July 17, 2019 at 11:59pm.

Searching for a research software engineer

Uncategorized No comments

We are searching for a research software engineer to work on research related to the Fragile Families Challenge.  The project will be a mix of software engineering, data science, and social science.  Application review begins soon.  Here is a link to the full  position description: https://main-princeton.icims.com/jobs/10347/research-software-engineer/job

computational reproducibility and the Fragile Families Challenge

Uncategorized No comments

We’ve recently posted a working paper about our experiences with computational reproducibility and the Fragile Families Challenge special issue.

Successes and struggles with computational reproducibility: Lessons from the Fragile Families Challenge

David M. Liu and Matthew J. Salganik

Abstract: Reproducibility is fundamental to science, and an important component of reproducibility is computational reproducibility: the ability of a researcher to recreate the results in a published paper using the original author’s raw data and code. Although most people agree that computational reproducibility is important, it is still difficult to achieve in practice. In this paper, we describe our approach to enabling computational reproducibility for the 12 papers in this special issue of Socius about the Fragile Families Challenge. Our approach draws on two tools commonly used by professional software engineers but not widely used by academic researchers: software containers (e.g., Docker) and cloud computing (e.g., Amazon Web Services). These tools enabled us to standardize the computing environment around each submission, which will ease computational reproducibility both today and in the future. Drawing on our successes and struggles, we conclude with recommendations to authors and journals.

Making it easier to work the Fragile Families metadata in R and Python

Uncategorized No comments

One thing we noticed during the Fragile Families Challenge is that some participants struggled to work with the data and metadata. So, after the Challenge ended, we used what we learned to rebuild the Fragile Families and Child Wellbeing Study data and metadata, making it easier to use. This process is described in more detail in our paper: “Improving metadata infrastructure for complex surveys: 
Insights from the Fragile Families Challenge.” Now we are happy to announce the release of an R package (ffmetadata) and a Python package (ffmetadata-py) that make it easier to work with the Fragile Families metadata without leaving your data analysis environment.

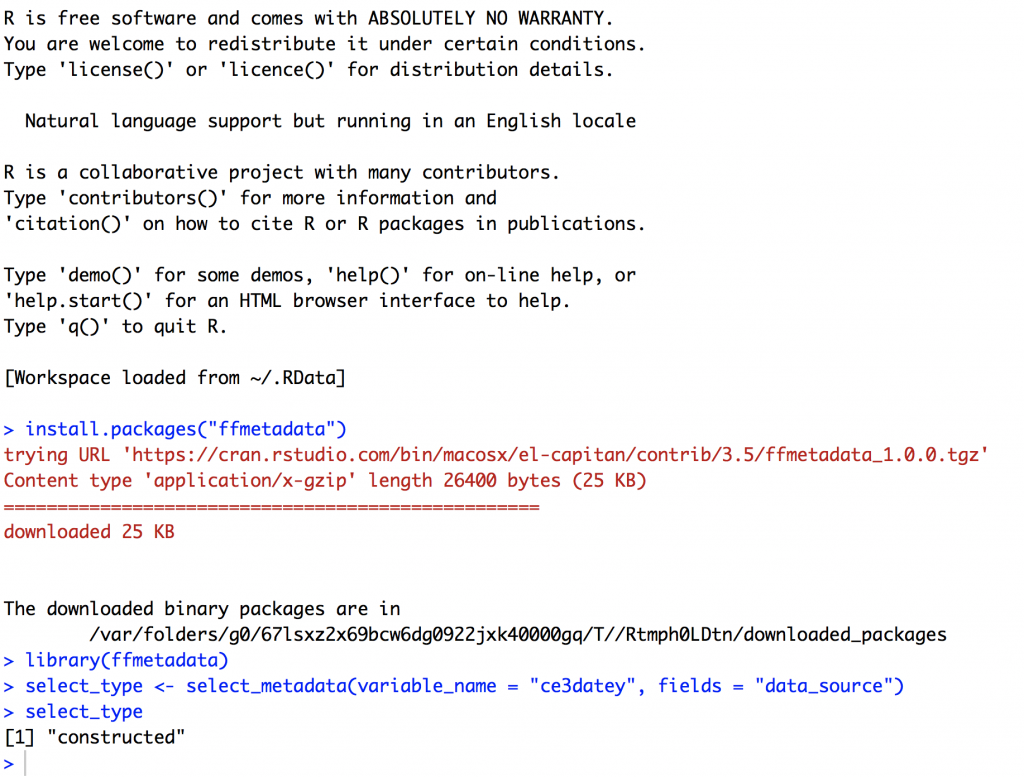
Here’s an example of how you could install and use the R package:

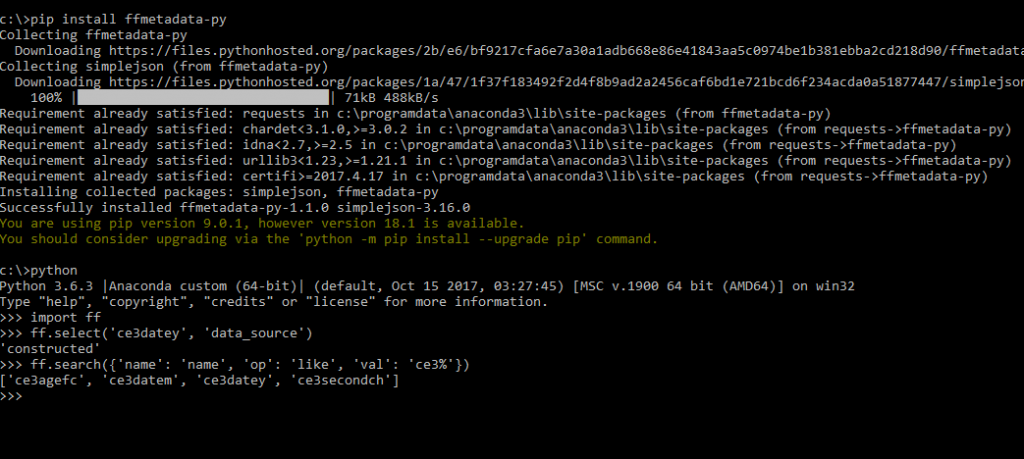
And, here’s an example of how you could install and use the Python package:

Basically, both of these packages are convenient wrappers around the metadata API. You can read more about the design of the API in our paper “Improving metadata infrastructure for complex surveys: 
Insights from the Fragile Families Challenge.”

The R package was written by Ryan Vinh, with assistance from Ian Fellows and Will Lowe. The Python package was written by Vineet Bansal. The code for both packages is available open source:

Presentation about the Fragile Families Challenge: November 8, 2018 at Brown

Uncategorized No comments

We will be giving a talk about the Fragile Families Challenge on Thursday, November 8, 2018 in the Population Studies and Training Center (PTSC) Seminar Series at Brown University. The talk will be in Mencoff Hall, Seminar Room 205 at noon. The talk is open to everyone.

Here’s more information: https://www.brown.edu/academics/population-studies/event/fragile-families-challenge

Presentation about the Fragile Families Challenge: October 22, 2018 at Princeton

Uncategorized No comments

We will be giving a talk about the Fragile Families Challenge on Monday, October 22, 2018 at 4:00 pm in the Program in Applied and Computational Mathematics (PACM) Colloquium at Princeton University. The talk will be in Fine Hall, Room 214. This talk is open to everyone.

Here’s more information: https://www.pacm.princeton.edu/events/pacm-colloquium-matthew-salganik-princeton-university

Fragile Families Challenge at the American Sociological Association Annual Meeting

Uncategorized No comments

We will be presented three papers about the Fragile Families Challenge at the 2018 American Sociological Association Annual Meeting, which will be in Philadelphia August 11–14. Please come to these sessions to learn more about the Challenge.

Data-driven Data Provision: A Case Study from the Fragile Families Challenge
Sun, August 12, 8:30 to 10:10am, Philadelphia Marriott Downtown, Level 4, 404

Metadata provides critical support for researchers working with public datasets, but new methods at times outgrow what existing data infrastructure is able to support. This paper describes what happened when a large, heterogeneous group of researchers used a complex social data set in a way that was not originally envisioned by its creators. Using the Fragile Families Challenge as a case study, we identify five strategic areas where improving metadata — variable names, response codes, cross-questionnaire matching, concept tags, and release format — can make data use easier for everyone. More generally, we illustrate some of the unintentional and invisible barriers that are preventing the use of machine learning methods in the social sciences, and suggest that data system design is a fundamental research problem for the field of computational social science.

The Fragile Families Challenge: Predictability of Family and Child Well-being in Adolescence
Sun, August 12, 10:30am to 12:10pm, Philadelphia Marriott Downtown, Level 4, Franklin Hall 8

Scholars have long hypothesized that childhood experiences play an important role in the process by which socioeconomic status is reproduced across generations. The predictive power of attainment models, however, has been so weak that pioneers of the field have commented that random chance must play an important role. We hypothesize another possible source of poor predictive performance: untapped modeling potential. Modern machine learning approaches often yield better predictions than parametric regression models, yet social scientists have not fully exploited this opportunity. In this paper, we report on how 159 research teams from 68 institutions in 7 countries used rich survey data covering 2,121 training observations on 12,942 variables to produce predictive models that together set a benchmark of predictive performance for outcomes identified by social scientists as important factors in the status attainment process. We narrow our focus to a critical point of the life course: predicting adolescent outcomes as a function of childhood experiences. Each team developed a predictive model that was evaluated on a set of outcome observations available only to the organizers. Results suggest that (a) predictive performance outpaced approaches more common in social science, but (b) overall predictive performance was poor. We close with a discussion of the potential reasons for poor predictive performance in social science research. Given the theoretical importance of childhood experiences in the process of stratification, our results should be of interest to scholars of stratification, socio-economic mobility, child development, and statistical methods.

Privacy, Ethics, and Computational Social Science: A Case Study of the Fragile Families Challenge
Mon, August 13, 4:30 to 6:10pm, Philadelphia Marriott Downtown, Level 4, Franklin Hall 12

New sources of “big data” created by companies and governments hold great promise for advancing social science. Unfortunately, a fundamental barrier preventing researchers from achieving this promise is data access. Quite simply, most big data sources are not accessible to researchers. Therefore, developing procedures that enable safe and ethical data access represent an important methodological problem in computational social science. In this paper, we present our process for enabling data access during the Fragile Families Challenge, a scientific mass collaboration designed to improve the lives of disadvantaged children in the United States. We describe our process of threat modeling, threat mitigation, and third-party oversight. We also describe the ethical principles that formed the basis of our process. Ultimately, we hope that the approach that we developed will be helpful to researchers who seek data access and data custodians who wish to provide data access.

Fragile Families Challenge and Princeton AI4ALL

Uncategorized No comments

AI4ALL is a non-profit educational program designed to increase the diversity of researchers working in AI. This summer there is an AI4ALL program at Princeton, and one of the projects participants will work on in a modified version of the Fragile Families Challenge. We look forward to seeing what new insights these students bring to the Challenge.

If you would like to use a modified version of the Fragile Families Challenge in your teaching or research, please contact us.

computational reproducibility and the Fragile Families Challenge special issue

Uncategorized No comments

We are currently editing a special issue of Socius about the Challenge. For this special issue, we are striving for a standard of computational reproducibility, which means that other researchers should be about to recreate the results in all of the papers. Therefore, while the manuscripts have been undergoing peer review, we have also been attempting to replicate the results in each paper. This has turned out to be trickier than we expected. In this post, I’d like to briefly summarize what we’ve done so far, and then share a set of guidelines that we’ve developed and shared with our authors. If you have ideas for how these guidelines can be improved, please let us know. Ultimately, we hope that the guidelines will be a helpful resource for authors and editors who wish to promote computational reproducibility, either in their own work or the work of others.

Our replication efforts have been spearheaded by David Liu, and this work will be part of his senior thesis in Princeton’s Department of Computer Science. In attempting to replicate the results of each paper, David has noticed helpful things that some authors have done, and he’s found some problems that come up over and over. Therefore, when we sent back decisions on the manuscripts, we also sent the feedback below on code. Just as authors have to revise and resubmit their manuscripts, for the special issue, authors will have to revise and submit their code. These guidelines are intended to help with that process.

Background behind reproducibility guidelines

First, we’d like to step back from the details to describe the high-level goal. We want your articles to be computationally reproducible, which means that another researcher could regenerate the results in your paper using the Challenge data, your code, and any additional data that you have created. Computational reproducibility will increase the impact of your work individually, and it will increase the contribution of the Challenge collectively.

As we’ve learned during this first round of reviews, the goal of computational reproducibility is widely shared by scientists, easy to state, and tricky to achieve. Based on what we’ve learned from your code, our thinking on how to achieve this goal issues has evolved. In particular, we’ve been very influenced by the idea of a “research pipeline” described by Peng and Eckel (2014), which is nicely captured by this figure: http://bit.ly/2qrTWXK.

The goal of this document is to provide you with guidelines that support computational reproducibility of your entire research pipeline, which goes from raw data to final output. You don’t have to follow these guidelines exactly; if you devise a system that you think is better, you are welcome to use it. But, if you have no system in place, we are going to strongly encourage that you adopt these guidelines.

The Guidelines

The most important thing to keep in mind is that we are asking you to create one single script named “run_all” that executes all the necessary files to go from the raw data to the final results. One way to do this is to write a bash script that calls the submission files in sequence. An example of a simple bash script is shown below:

Running the above script will execute each line, one after another. Note that the screen shot includes examples for many common languages. More background information on writing bash scripts is available at: https://ryanstutorials.net/bash-scripting-tutorial/bash-script.php. Of course, you may write the run_all script in the language of your choice so long as it can be executed from the command line.

While you are creating this script, we think it will be helpful to organize your input files, intermediate files, and output files into a standard directory (i.e., folder) structure. We think that this structure would help you create a modular research pipeline; see Peng and Eckel (2014) for more on the modularity of a research pipeline. This modular pipeline will make it easier for us to ensure computational reproducibility, and it will make it easy for other researchers to understand, re-use, and improve your code.

Here’s a basic structure that we think might work well for this project and others:

data/
code/
output/
README
LICENSE

In the data/ directory you can include:

  • background.csv (this should not actually be included because of privacy constraints, but we will put it here)
  • train.csv (this should not actually be included because of privacy constraints, but we will put it here)
  • Supplemental materials such as metadata files, the constructed-data dictionary, the machine-readable codebook.
  • Data that you have collected or created, such as a csv file that you manually created that has your MSE scores on the holdout data and/or an analytic dataset created by your code.

In your code/ directory you can include:

  • Executable “run all” script that when run goes from raw inputs all the way to final outputs (for this script we encourage you to think about the research pipeline idea from Peng and Eckel 2014: http://bit.ly/2qrTWXK)
  • Source code files each with a useful header (see FAQ).
  • Package requirements

In your output/ directory you can include:

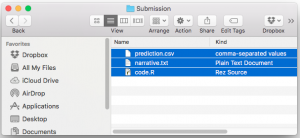
  • prediction.csv
  • A subdirectory for tables
  • A subdirectory for figures (we also recommend including all data files that can be used to recreate the figures; see rule 7 of Sandve et al. 2013)

In addition to these three main directories, you should also include a README file and LICENSE file. We have more information about these files in the FAQ below. We hope that these guidelines are help, and please let us know if you have any questions.

Code Resubmission Process

Once you think you are ready to resubmit, here’s a checklist that you can follow to help ensure that your work will be computationally reproducible:

  • I have written the kind of README file that I would like to read (see FAQ below)
  • Each code file that I’ve written has a header that will be helpful (see FAQ below)
  • I’ve run the submission and I can get from raw files to final output using only materials in my directories. Then, I’ve done this again and I get the same result. This second step helps check for problems with seeding.
  • I’ve considered refactoring my code (see FAQ below)

Finally, when you resubmit, we ask that you include a revision memo about the code, just as you will about the manuscript. This revision memo should summarize changes that you have made. In this revision memo, please also include a rough estimate of the cumulative amount of time it took you to comply with these guidelines. We are asking for this time estimate because one objection to computational reproducibility is that it is too burdensome for authors and we would like to assess this empirically. Finally, please include any suggestions for how this process could have been easier or more efficient.

F.A.Q.

What should go in the README file?

The README file should provide an overview of your code. For example, it could include a diagram showing the different pieces of their code, their inputs and their outputs. If relevant, please include expected warnings when executing the code. Mention any provided “intermediate results” readers can utilize to decompose the submission into smaller pieces.

The README should also include something about your computing environment and expected run time; general terms are appropriate here. For example: “I ran this on a modern laptop (circa 2016) and it ran in a few minutes.” or “This code ran on high-performance cluster and took one week.” Finally, please clearly cite any open sourced content utilized in the submission, such as resources shared in the FFC blog or more general packages distributed in the computation community.

What headers should be included at the top of each piece of code?

Based on the ideas in Nagler (1995), we think the following elements should be included at the top of each piece of code:

  • Purpose (in 140 characters or less)
  • Inputs
  • Outputs
  • Machine used (e.g., laptop, desktop, cluster)
  • Expected runtime (e.g., seconds, minutes, hours, days, etc)
  • Set the seed at the beginning of each file (see rule 6 of Sandve et al. 2013)
  • All the package include statements (e.g., “library(ggplot2)” in R)

If you would like to deviate from this standard, please contact us.

How can I make my code easier to read?

It is hard to offer general advice, but one thing that we can recommend is at the end of the process take some time to refactor your code (https://en.wikipedia.org/wiki/Code_refactoring). In our experience, code evolves over the course of a project, and at the end it can be helpful to refactor in order to clean up the structure, improve variable names, and promote modularity.

Even if you don’t refactor your code, please include additional comments to helper functions and code segments that may be obscure to new readers.

What is our standard for computational reproducibility for the special issue?

Our standard for computational reproducibility for this special issue is that we should be able to take whatever code and data you submit, add the Fragile Families Challenge data file, and then reproduce all of the figures in your paper, all of the tables in your paper, and your predictions.csv file.

What is not included in our standard for computational reproducibility for the special issue?

We will not attempt to completely recreate your analysis from the written materials. Also, we will not verify that your description in the paper matches the code. For example, if the paper says that you use logistic regression to generate your predictions, we will not verify that the code also uses logistic regression. Further, we will not verify the information that you have provided from external sources. For example, if you write in the paper that your submission was 10th on the leaderboard, we will not verify this fact. Finally, we will not verify any of the numbers that are included in the text of the manuscript. For example, we would not verify a claim in the text such as: dropping variables with no variation removes 10% of variables. As we hope this list illustrates, our standard of computational reproducibility is in fact quite limited.

What license should I use?

We strongly recommend the MIT license. You can find it here: https://opensource.org/licenses/MIT. Simply replace with 2018 and with the name of all co-authors of the paper, in the order they are listed in the paper. If you would like to use some other license, please contact us.

What should I read to learn more about computational reproducibility?

Here’s a partial list. If we’ve left off a good resource, please let us know (fragilefamilieschallenge@gmail.com).

Nagler (1995) “Coding Style Good Computing Practices” PS: Political Science & Politics. (open access version)

Peng and Eckel (2009) “Distributed Reproducible Research Using Cached Computations” Computing in Science & Engineering.

Sandvae et al (2013) “Ten Simple Rules for Reproducible Computational Research” PLOS Computational Biology.

Stodden et al (2016) “Enhancing reproducibility for computational methods” Science.

Fragile Families Challenge special issue feedback

Uncategorized No comments

We’ve recently completed the first round of reviews for papers in the special issue of Socius about the Fragile Families Challenge. There were many really interesting manuscripts submitted, but there were a variety of issues that came up repeatedly in the reviews. Therefore, in addition to providing feedback on each manuscript individually, we also developed some overall feedback that we provided to all authors. We are posting that feedback here in the hopes that it might help others who are planning to run a mass collaboration and publish a special issue.

Feedback to all authors

Based on our reading of all submissions and all reviews, we are encouraging all authors submitting revisions to the special issue to give extra attention to reviewer comments in the following three areas:

1) Accuracy. We are encouraging all revisions to focus on more clearly describing what they did, why they did it, and what might be learned from it. You must accurately report what you did. When reviewers ask why you did something, this is an important question to address. For the purpose of the special issue, you do not always need a formal justification for making a decision; if you just thought it seemed reasonable, you should say that.

In addition, we are encouraging all authors to clearly report all of their results, not just those that make their approach look more promising. When deciding whether to publish the paper, a major factor for us will be whether the paper communicates clearly the strengths and weaknesses of the approach. This factor will be much more important than whether the results are “interesting” or “promising.” Any reviewer comments about selective reporting are especially important to address.

If you used an approach that required tuning parameters (e.g., the lambda parameter in LASSO), please say how you set the parameters. The most common approaches seem to be cross-validation or using the defaults in the software. This should be clear in the papers.

2) Interest. A reader of your paper should quickly see why it would be of interest to some social scientists or some data scientists. We encourage you to add a few sentences in the introduction that that clarifies what you think are the most interesting or important ideas or results in your paper. Again, we think this will be helpful given the interdisciplinary nature of the readership. Also, if you think the main contribution is to establish the baseline against which future efforts can be compared, we think that is an important contribution.

3) Presentation. It is very important that the special issue be readable for both data scientists and social scientists. These communities sometimes use different language, and we have sought reviewers from both cultures. When reviewers are confused about something common in your field, realize that an extra sentence or reference might make the paper more readable to a diverse audience, thereby increasing the impact of your paper.

Also, inconsistent terminology often stands in the way of effective presentation. Be careful that your manuscript uses internally consistent terminology. One recommendation to promote consistency is to choose a book or an authoritative article and use its terminology. This way, terminology will be internally consistent, and confused readers are immediately pointed toward a source that can help them understand.

Stepping back from these three areas of focus, we would like to remind authors that the use of online supporting material can greatly improve accuracy, interest, and presentation. Yet very few of the manuscripts used this opportunity. Online supporting materials can be arbitrarily long and provide an opportunity to be clear about even the most mundane decisions (accuracy), reduce clutter in the paper so that non-specialists can follow the main ideas (interest), and provide an outlet to share details with researchers who wish to understand and build on your work (presentation). If there is part of your paper that will be of interest to only a small subset of readers, we strongly encourage you to put this information in the online supporting materials.

Based on our reading of all submissions and all reviews, we are encouraging all authors submitting revisions to the special issue to make certain formatting changes:

1) In the acknowledgements, you should list and cite the software that you use. This will promote reproducibility and give academic credit to folks that create software. We recommend these two sentences like this: “The results in this paper were created with software written in R 3.3.3 (R Core Team, 2017) using the following packages: ggplot2 2.2.1 (Wickham, 2009), broom 0.4.2 (Robinson, 2017), and caret 6.0-78 (Kohn, 2017). Replication code for this article is available at [ url coming soon, we are still exploring permanent homes for your code ].” If you would like to learn more about citations in R, we recommend: http://www.blopig.com/blog/2013/07/citing-r-packages-in-your-thesispaperassignments/ If you would like to learn more about citations in Python, we recommend: https://www.scipy.org/citing.html. We realize that citation standards for software are still evolving, so please ask if you have any questions.

2) Each of your papers should acknowledge the funders of the Fragile Families and Child Wellbeing Study and the funders of the Fragile Families Challenge. Therefore, we ask you add these sentences to the acknowledgements section of your paper: “Funding for the Fragile Families and Child Wellbeing Study was provided by the Eunice Kennedy Shriver National Institute of Child Health and Human Development through grants R01HD36916, R01HD39135, and R01HD40421 and by a consortium of private foundations, including the Robert Wood Johnson Foundation. Funding for the Fragile Families Challenge was provided by the Russell Sage Foundation.”

3) Several reviewers who were not part of the Challenge found the papers slightly confusing. Although we previously told you not to describe the Challenge, we think that was a mistake. You are writing a paper for a special issue of a journal, not a book chapter. Therefore, we would ask that you add one paragraph in the introduction of your paper providing a brief overview of the Challenge. Obviously the entire Challenge cannot be described in one paragraph, so you can cite our introduction to the special issue to provide more information. For now you can cite the introduction as Salganik, Lundberg, Kindel, and McLanahan “Introduction to the special issue on the Fragile Families Challenge.” We think this change will help make the articles more self-contained and will therefore increase their impact.

4) We encourage you to add a single paragraph in the introduction section of your paper that provides a roadmap to your paper. For example, “In Section 2 we describe our approach to data preparation. Then, in Section 3 we describe our procedure for variable selection. In Section 4, we describe the different models we used for prediction and compare their performance. In Section 5, we attempt to interpret the predictive models. The paper conclusions with recommendations for future research.” Although many short papers do not require this kind of roadmap, we think that it will be helpful given the interdisciplinary nature of the readership.

We are offering the two forms of support below to help you write the best paper possible.

1) Additional analyses. If the authors would like to undertake additional analyses that would require access to the holdout data, we would be happy to help facilitate that so long as all results are reported in the paper as post-Challenge results.

2) Talk with editors. We believe an open exchange often produces the best papers. If you have any questions please email us (fragilefamilieschallenge@gmail.com). If the authors would like to talk to us after having read through the reviews and charted a plan for the revisions, feel free to email us, and we would be happy arrange that.

Regarding your code, some of you have already heard from us about our efforts to reproduce your results and others will hear from us soon. We hope that while you are revising and improving your paper, you will also revise and improve your code. You will receive more specific instructions from us soon.

Fragile Families Challenge data are now available

Uncategorized No comments

Researchers interested in using the data from the Fragile Families Challenge can now apply for access through the Office of Population Research data archive. We hope that this data will be used to replicate and extend research conducted during the Challenge. We also hope that this data will be used in teaching. Many participants in the Challenge began working on it in a class, and we’ve heard from professors that the Challenge provides a great learning opportunity.

FAQ

videos from the Fragile Families Challenge Scientific Workshop

Uncategorized No comments

The Fragile Families Challenge Scientific Workshop was a two-day event. On the first day, authors led small group discussions about their papers for the special issue of Socius, and we had a number of breakout projects. Then, on the second day, there were presentations from prize winners. These talked were livestreamed, and I’m happy to now announce that the videos of these talks are now available. We hope that you enjoy them as much as we did.

Upcoming event: The Future of Big Data and Survey Methods

Uncategorized No comments

We are excited to have a chance to discuss the Fragile Families Challenge as part of a panel at the University of Michigan, Institute for Social Research. The title of the panel is: The Future of Big Data and Survey Methods. Please join us at the event. More information is below.

Description:
New Data Science methods and mass collaborations pose both exciting opportunities and important challenges for social science research. This panel will explore the relationship between these new approaches and traditional survey methodology. Can they coexist, or even enrich one another? Matthew Salganik is one of the lead organizers of the Fragile Families Challenge, which uses data science approaches such as predictive modeling, mass collaboration, and ensemble techniques. Jeremy Freese is co-PI of the General Social Survey and of a project on collaborative research in the social sciences. Colter Mitchell has conducted innovative work combining biological data and methods with Fragile Families and other survey data sets.

Sponsored by the Computational Social Science Rackham Interdisciplinary Workshop and the Population Studies Center’s Freedman Fund.

Friday, 10/6/2017, 3:10 PM
Location: 1430 ISR-Thompson

Correction to prize winners

Uncategorized No comments

When newspapers have to correct a published article, they issue a correction that notes the errors in the prior version and how they have been corrected. Following this logic, this blog post explains a correction we have made to the prize winners blog.

At the close of the Challenge, one team (MDRC) mistakenly believed that the submission deadline, listed as 6pm UTC on Codalab, was 6pm Eastern Time. After the close of the Challenge at 2pm, they were unable to upload their submission. They emailed us very soon after the 2pm deadline indicating that they had misunderstood. Our Board of Advisors reviewed the case carefully and decided to accept this submission. We made this decision before we opened the holdout data.

When we actually evaluated the submissions with the holdout data, we downloaded all final submissions from Codalab and neglected to add the e-mailed MDRC submission to the set. The team noticed they were not on the final scores page and emailed us to ask. A week after opening the holdout set, we added their submission to the set, re-evaluated all scores, and discovered that this team had achieved the best score in eviction and job training, two prizes we had already awarded to other teams.

In consultation with our Board of Advisors, we decided to do three things.

First, we updated the final prize winners to recognize MDRC.

Second, we recognized that this was an unusual situation. Other teams had rushed to the 2pm deadline and might have scored better with a few extra hours of work. For this reason, we decided to create a new category: special honorary prizes. If MDRC won for an outcome, the second-place team (i.e. the team that was in first place at the close of the Challenge at 2pm) would be awarded a special honorary prize.

Third, we updated the prize winners figure and score ranks to include MDRC along with all submissions previously included.

All prize winners (final, progress, innovation, foundational, and special honorary) are invited to an all-expense-paid trip to Princeton University to present their findings at the scientific workshop.

Prize winners

Uncategorized 1 comment

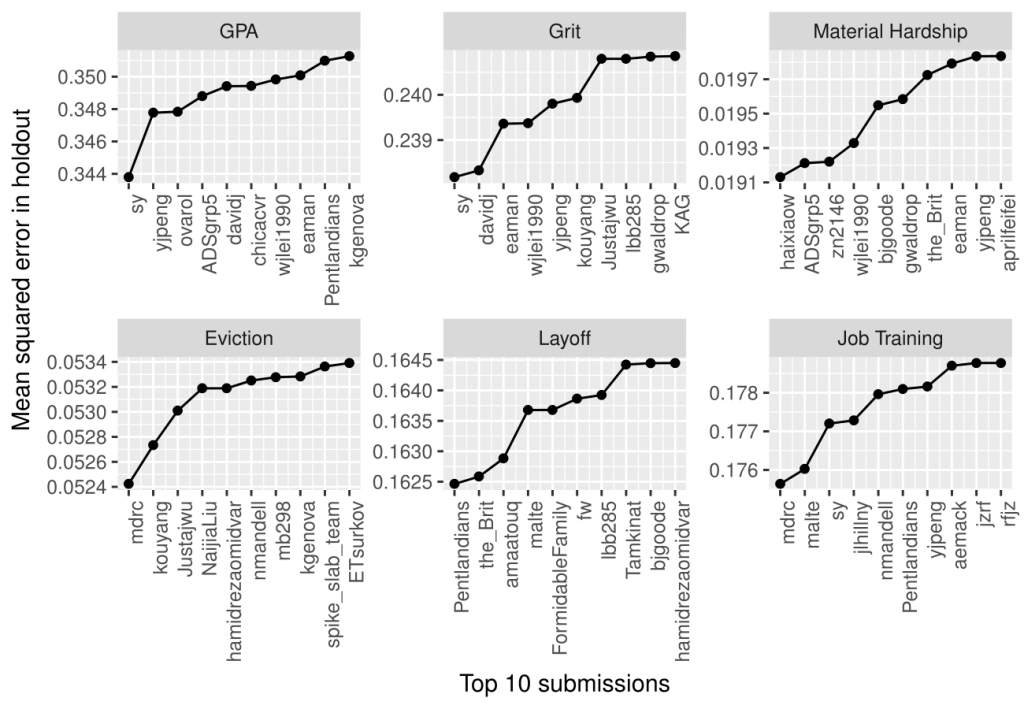
The Fragile Families Challenge received over 3,000 submissions from more 150 teams between the pilot launch on March 3, 2017, and the close on August 1, 2017. Each team’s final submission score on the holdout set is provided at this link. In this blog post, we are excited to announce the prize winners!

Final prizes

We are awarding prizes to the top-scoring submissions for each outcome, as measured by mean-squared error. The winners are:

  • GPA: sy (MIT Media Lab, Human Dynamics Group: Abdullah Almaatouq, Eaman Jahani, Daniel Rigobon, Yoshihiko Suhara, Khaled Al-Ghoneim, Abdulla Alhajri, Abdulaziz Alghunaim, Alfredo Morales-Guzman)
  • Grit: sy (MIT Media Lab, Human Dynamics Group: Abdullah Almaatouq, Eaman Jahani, Daniel Rigobon, Yoshihiko Suhara, Khaled Al-Ghoneim, Abdulla Alhajri, Abdulaziz Alghunaim, Alfredo Morales-Guzman)
  • Material hardship: haixiaow (Diana Stanescu, Erik H. Wang, and Soichiro Yamauchi; Ph.D. students, Department of Politics, Princeton University)
  • Eviction: MDRC (Kristin Porter, Richard Hendra, Tejomay Gadgil, Sarah Schell, and Meghan McCormick)
  • Layoff: Pentlandians (MIT Media Lab, Human Dynamics Group: Abdullah Almaatouq, Eaman Jahani, Daniel Rigobon, Yoshihiko Suhara, Khaled Al-Ghoneim, Abdulla Alhajri, Abdulaziz Alghunaim, Alfredo Morales-Guzman)
  • Job training: MDRC (Kristin Porter, Richard Hendra, Tejomay Gadgil, Sarah Schell, and Meghan McCormick)

Progress prizes

As promised, we are also awarding progress prizes to the top-scoring submissions for each outcome among submissions made by May 10, 2017 at 2pm Eastern Time. The following teams had the best submission as of this deadline are:

  • GPA: ovarol (Onur Varol, postdoctoral researcher at the Center for Complex Network Research, Northeastern University Networks Science Institute)
  • Grit: rap (Derek Aguiar, Postdoctoral Researcher, and Ji-Sung Kim, Undergraduate Student, Department of Computer Science, Princeton, NJ)
  • Material hardship: ADSgrp5
  • Eviction: kouyang (Karen Ouyang and Julia Wang, Princeton Class of 2017)
  • Layoff: the_Brit (Professor Stephen McKay, School of Social & Political Sciences, University of Lincoln, UK)
  • Job training: nmandell (Noah Mandell, Ph.D. candidate in plasma physics at Princeton University)

Foundational award

Greg Gunderson (ggunderson) produced machine-readable metadata that turned out to be very helpful for many participants. You can read more about the machine-readable metadata in our blog post on the topic. In addition to being useful to participants, this contribution was also inspirational for the Fragile Families team. They saw what Greg did and wanted to build on it. A team of about 8 people is now working to standardize aspects of the dataset and make more metadata available. Because Greg provided a useful tool for other participants, open-sourced all aspects of the tool, and inspired important changes that will make the larger Fragile Families project better, we are awarding him the foundational award.

Innovation awards

The Board of Advisers of the Fragile Families Challenge would also like to recognize several teams for particularly innovative contributions to the Challenge. For these prizes, we only considered teams that were not already recognized for one of the awards above. Originally, we planned to offer two prizes: “most novel approach using ideas from social science” and “most novel approach using ideas from data science.” Unfortunately, this proved very hard to judge because many of the best submissions combined data science and social science.

Therefore, after much deliberation and debate, we have decided to award two prizes to for innovation. These submissions each involved teams of people working collaboratively. Each team thought carefully about the raw data and cleaned variables manually to provide useful inputs to the algorithm, much as a social scientist typically would. Each team then implemented well-developed machine learning approaches to yield predictive models.

We are recognizing the following teams:

  • bjgoode (Brian J. Goode, Virginia Tech, acknowledging Dichelle Dyson and Samantha Dorn)
  • carnegien (Nicole Carnegie, Montana State University, and Jennifer Hill and James Wu, New York University)

We are encouraging these teams to prepare blog posts and manuscripts to explain their approaches more fully. To be clear, however, there were many, many innovative submissions, and we think that a lot of creative ideas were embedded in code and hard to extract from the short narrative explanations. We hope that all of you will get to read about these contributions and more in the special issue of Socius.

Special honorary prizes

As explained in our correction blog post, our Board of Advisors decided to accept a submission that arrived shortly after the deadline, because of confusing statements on our websites about the hour at which the Challenge closed. This team (mdrc) had the best score for two outcomes (eviction and job training) and was awarded the final prize for each of these outcomes. Because we recognize that this was an unusual situation, we are awarding special honorary prizes to the second-place teams for each of these outcomes.

  • Eviction: kouyang (Karen Ouyang and Julia Wang, Princeton Class of 2017)
  • Job training: malte (Malte Moeser, Ph.D. student, Department of Computer Science, Princeton University)

Conclusion

Thank you again to everyone that participated. We look forward to more exciting results to come in the next steps of the Fragile Families Challenge, and we hope you will join us for the scientific workshop (register here) at Princeton University on November 16-17!

Fragile Families Challenge, next steps

Uncategorized No comments

Stage one of the Fragile Families Challenge, the predictive modeling stage, ended today at 2pm ET.  We are grateful to everyone who participated.  This is not, however, the end of the Fragile Families Challenge.  In fact, there are many important and exciting things to come.  We will be:

We are looking forward to all of the next steps in the Fragile Families Challenge.

Fragile Families Challenge Scientific Workshop, Nov 16 & 17

Uncategorized No comments

We are happy to announce the Fragile Families Challenge Scientific Workshop will take place November 16th and 17th (Thursday and Friday) at Princeton University.  The workshop is open to everyone interested in the Challenge, and we will be livesteaming it for people who are not able to travel to Princeton (note: videos of the talks are now available).

On Thursday, we will meet in Palmer House (map). On Friday, we will meet in Wallace Hall 300 (map).

The schedule will be:

  • Thursday: Workshop of submissions to the special issue of Socius and breakout projects. All are welcome regardless of whether you have written a paper.
  • Friday: Presentations by prize winners. All are welcome to attend, regardless of whether you have won a prize.

If you plan to join us, please complete the registration form.

Thursday, November 16

The first day of the Fragile Families Challenge Scientific Workshop will be devoted to: 1) workshopping papers submitted to the Special Issue of Socius on the Fragile Families Challenge and 2) working on breakout projects.

Workshopping papers

Before the workshop, each participant will be sent 3 papers to read. Participants are expected to read these papers before arriving at the workshop. This will ensure that we have a lively and focused discussion. If you are unable to read the papers ahead of time, please let us know and plan to arrive at lunch time.

Then at the workshop, each paper will be discussed for 45 minutes in a series of parallel roundtable sessions. There will be no presentations by the author because everyone will have read the paper ahead of time. Instead, each session will begin with very brief comments by a pre-assigned moderator, and then there will be a group discussion, which will be facilitated by the moderator. We expect these to be lively, fascinating, and generative discussions.

  • “Black Box Models and Sociological Explanations: Predicting GPA Using Neural Networks” by Thomas Davidson
  • “Humans in the Loop: Priors and Missingness on the Road to Prediction” by Connor Gilroy, Anna Filippova, Ridhi Kashyap, Antje Kirchner, Allison Morgan, Kivan Polimis, Adaner Usmani, and Tong Wang
  • “Privacy, ethics, and high-dimensional social science data: A case study of the Fragile Families Challenge” by Ian Lundberg, Arvind Narayanan, Karen E.C. Levy, and Matthew J. Salganik
  • “Making the analysis of complex survey data more efficient, reliable, and enjoyable: A case study from the Fragile Families Challenge” by Alexander T. Kindel, Kristin Catena, Tom Hartshorne, Kate Jaeger, Dawn Koffman, Sara S. McLanahan, Maya Phillips, Shiva Rouhani, and Matthew J. Salganik
  • “Modeling and Decision Making with Social Systems: Lessons Learned from the Fragile Families Challenge” by Brian Goode, Debanjan Datta, and Naren Ramakrishnan
  • “The Pentlandians ensemble: Winning models for GPA, grit, and layoff in the Fragile Families Challenge” by Daniel Rigobon, Eaman Jahani, Yoshihiko Suhara, Khaled AlGhoneim, Abdulaziz Alghunaim, Alex Pentland, and Abdullah Almaatouq
  • “Predicting material hardship using machine learning” by Erik H. Wang, Diana Stanescu, and Soichiro Yamauchi
  • “The challenges of data science from social science: Using social science knowledge in the Fragile Families Challenge” by Stephen McKay
  • “Predictive features of children GPA in Fragile Families” by Naijia Liu, Hamidreza Omidvar, and Jinjin Zhao
  • “Variable selection and parameter tuning for BART modeling in the Fragile Families Challenge” by James Wu and Nicole Carnegie

Breakout activities

With so many amazing people all in one place, we also wanted to leave time for ideas that you propose, either ahead of time or as a result of the workshopping of the papers. Any participant can propose an idea, and then people can choose which one they want to work on. We’re also going to propose the following projects:

  • Code walkthrough for the new Fragile Families metadata API (lead by Maya Phillips)
  • Demo and testing for new metadata website (lead by Alex Kindel)
  • Testing and improving the Docker container that ensure reproducibility of the special issue (lead by David Liu)
  • Assessing test-retest reliability of concept tags (lead by Kristin Catena)
  • Help us digitize question and answer texts (lead by Tom Hartshorne)

Schedule for Thursday

  • 08:30 – 09:00 Breakfast
  • 09:00 – 09:15 Intro
  • 09:15 – 10:00 Round 1 of papers
  • 10:00 – 10:15 Break
  • 10:15 – 11:00 Round 2 of papers
  • 11:00 – 11:15 Break
  • 11:15 – 12:00 Round 3 of papers
  • 12:00 – 1:00 Lunch
  • 1:00 – 1:30 Discussion of project ideas
  • 1:30 – 5:00 Breakout activities
  • 5:00 – 6:00 Break
  • 6:00 – ??? Dinner

Friday, November 17

The second day of the Fragile Families Challenge Scientific Workshop will be devoted to presentations from the organizers and prize winners.  Videos of these talks are now available.

  • 8:30 – 9:00. Breakfast
  • 9:00 – 9:45. Welcome, Overview of the Fragile Families Challenge
    • Matthew J. Salganik, Professor of Sociology, Princeton University
    • Sara S. McLanahan, William S. Tod Professor of Sociology and Public Affairs at Princeton University and Principal Investigator of the Fragile Families and Child Wellbeing Study
  • 9:45 – 10:00. Break
  • 10:00 – 11:15. Presentations from progress prize winners and discussion
    • Onur Varol, Postdoctoral Researcher, Center for Complex Network Research, Networks Science Institute, Northeastern University
    • Julia Wang, Princeton University
    • Stephen McKay, School of Social & Political Sciences, University of Lincoln, UK
  • 11:15 – 11:30. Break
  • 11:30 – 12:00. Presentation from foundational prize winner and discussion
    • Gregory Gundersen, PhD Student in Computer Science, Princeton University
  • 12:00 – 1:00. Lunch
  • 1:00 – 2:00. Presentations from innovation prize winners and discussion
    • Nicole Carnegie, Assistant Professor of Statistics, Montana State University
    • Brian J. Goode, Research Scientist, Discovery Analytics Center, Virginia Tech
  • 2:00 – 2:30. Break
  • 2:30 – 4:00 Presentations from final prize winners and discussion
    • Kristin Porter, Senior Associate, MDRC
    • Diana Stanescu, Erik H. Wang, and Soichiro Yamauchi, Ph.D. students, Department of Politics, Princeton University
    • Abdullah Almaatouq (MIT), Eaman Jahani (MIT), Daniel E. Rigobon (MIT), Yoshihiko Suhara (Recruit Institute of Technology and MIT)
  • 4:00 – 4:30. Break
  • 4:30 – 5:00. What’s next
    • Matthew J. Salganik, Professor of Sociology, Princeton University
    • Sara S. McLanahan, William S. Tod Professor of Sociology and Public Affairs at Princeton University and Principal Investigator of the Fragile Families and Child Wellbeing Study

We will update this page as we have more information. If you have any questions about the Scientific Workshop, please email us.

Getting scores on holdout data

Uncategorized 2 comments

As described in an earlier blog post, there will be a special issue of Socius devoted to the Fragile Families Challenge. We think that the articles in this special issue would benefit from reporting their scores on both the leaderboard data and the holdout data. However, we don’t want to release the holdout data on August 1 because that could lead to non-transparent reporting of results. Therefore, beginning on August 1, we will do a controlled release of the scores on the holdout data. Here’s how it will work:

  • All models for the special issue must be submitted by August 1.
  • Between August 1 and October 1 October 16 you can complete a web form requesting scores on the holdout data for a list of the models. We will send you those scores.
  • You must report all the scores you requested in your manuscript or the supporting online material. We are requiring you to report all the scores that you request in order to prevent selective reporting of especially good results.

We realize that this procedure is a bit cumbersome, but we think that this extra step is worthwhile in order to ensure the most transparent reporting possible of results.

Submit your request for scores here.

Event at the American Sociological Association Meeting

Uncategorized No comments

We are happy to announce that there will be a Fragile Families Challenge event Sunday, August 13 at 2pm at the American Sociological Association Annual Meeting in Montreal. We will gather at the Fragile Families and Child Wellbeing Study table in the Exhibit Hall (220c). We are the booth in the back right (booth 925). This will be a great chance to meet other participants, share experiences, and learn more about the next stages of the mass collaboration and the Fragile Families study more generally. See you in Montreal!

A Data Pipeline for the Fragile Families Challenge

Uncategorized 1 comment

Guest blog post by Anna Filippova, Connor Gilroy, and Antje Kirchner

In this post, we discuss the challenges of preparing the Fragile Families data for modeling, as well as the rationales for the methods we chose to address them. Our code is open source, and we hope other Challenge participants find it a helpful starting point.

If you want to dive straight into the code, start with the vignette here.

Data processing

The people who collect and maintain the Fragile Families data have years of expertise in understanding the data set. As participants in the Fragile Families Challenge, we had to use simplifying heuristics to get a grasp on the data quickly, and to transform as much of it as possible into a form suitable for modeling.

A critical step is to identify different variables types, or levels of measurement. This matters because most statistical modeling software transforms categorical covariates into a series of k – 1 binary variables, while leaving continuous variables untransformed. Because categorical variables are stored as integers, with associated strings as labels, a researcher could just use those integers directly in a model instead—but there is no guarantee that they would be substantively meaningful. For interpretation, and potentially for predictive performance, accounting for variable type is important.

This seems like a straightforward problem. After all, it is typically clear whether a given variable is categorical or continuous from the description in the codebook. With a handful of variables, classifying them manually is a trivial task, but this is impossible with over 12,000 variables. An automated solution that works well for the majority of variables is to leverage properties of the Stata labels, using haven, to convert each variable into the appropriate R class—factor for categorical variables, numeric for continuous. We previously released the results of this work as metadata, and here we put it to use.

A second problem similarly arises from the large number of variables in the Fragile Families data.  While some machine learning models can deal with many more parameters than observations (p >> n), or with high amounts of collinearity among covariates, most imputation and modeling methods run faster and more successfully with fewer covariates. Particularly when demonstrating or experimenting with different modeling approaches, it’s best to start out with a smaller set of variables. If the constructed variables represent expert researchers’ best attempts to summarize, consolidate, and standardize survey responses across waves, then those variables make a logical starting point. Fortunately, most of these variables can be identified with a simple regular expression.

Finally, to prepare for imputation, Stata-style missing values (labelled negative numbers) need to be converted to R-style NAs.

Missing data

Data may be missing in a (panel) study for many reasons, including respondent’s unwillingness to answer a question, a don’t know response, skip logic (for questions that do not apply to a given respondent), and panel attrition (for example, due to locating difficulties for families). Additional missing data might be due to data entry errors and—particularly relevant for the challenge—anonymization to protect sensitive information of members of a particularly vulnerable population.

What makes missing data such a challenge for computational approaches? Many statistical algorithms operate on complete data, often obtained through listwise deletion of cases. This effectively assumes that instances are missing completely at random. The Fragile Families data are not missing completely at random; moreover, the sheer amount of missingness would leave few cases remaining after listwise deletion. We would expect a naive approach to missingness to significantly reduce the predictive power of any statistical model.

Therefore, a better approach is to impute the missing data, that is, make a reasonable guess about what the missing values could have been. However, current approaches to data imputation have some limitations in the context of the Fragile Families data:

  • Standard packages like Amelia perform multiple imputation from a multivariate normal distribution, hence they are unable to work on the full set of 12,000 covariates with only 4,000 observations This is also computationally intensive, taking several hours to run even when using a regularizing prior, a subset of variables, and running individual imputations in parallel.
  • Another promising approach would be to use Full Information Maximum Likelihood estimation. FIML estimation models sparse data without the need for imputation, thus offering better performance. However, no open-source implementation for predictive modeling with FIML exists at present.
  • We could also use the existing structure of the data to make logical edits. For instance, if we know a mother’s age in one wave, we can extrapolate this to subsequent waves if those values are missing. Carrying this idea a step further, we can make simple model-based inferences; if, for example, a father’s age is missing entirely, we can impute this from the distribution of differences between mother’s and father’s ages. This process, however, requires treating each variable individually.

To address some of these issues, our approach to missing data considers each variable in the data-set in isolation (for example cm1hhinc, mother’s reported household income at wave 1), and attempts to automatically identify other variables in the data-set that may be strongly associated with this variable (such as cm2hhinc, mother’s reported household income at wave 2 and cf1hhinc, father’s reported household income at wave 1). Assembling a set of 3 to 5 of such associations per variable allows us to construct a simple multiple-regression model to predict the possible value of the missing data for each column (variable) of interest.

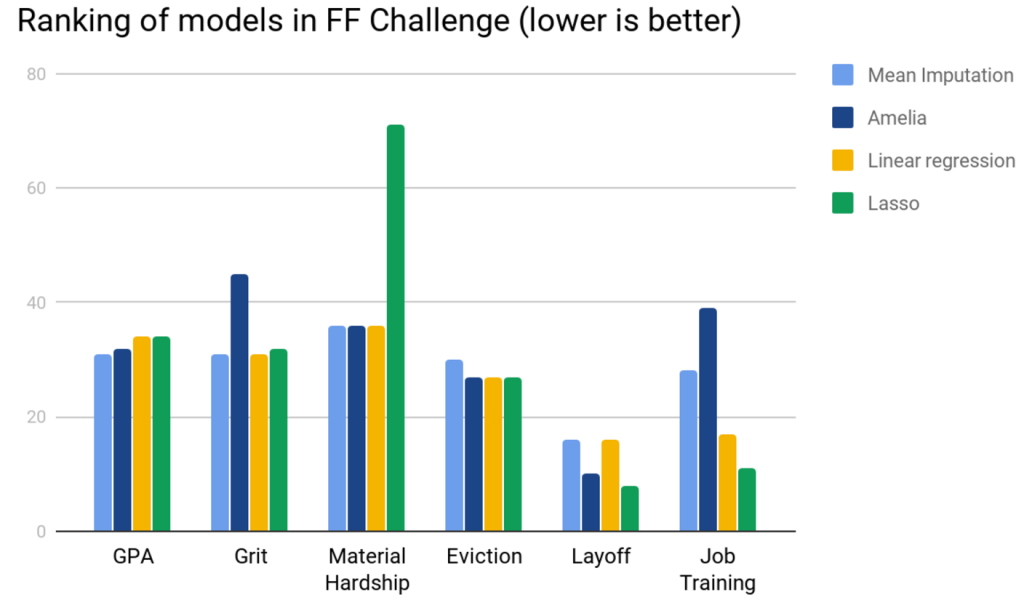
Our approach draws on two forms of multiple-regression models, a simple linear ordinary-least squares regression, and a linear regression with lasso penalization. To evaluate their performance, we compare our approach to two alternative forms of imputation: a naive mean-based imputation, and imputation using the Amelia package. Holding constant the method we use to make predictions and the variables used, our regression-based approach outperforms mean imputation on the 3 categorical outcome variables: Eviction, Layoff, and Job Training. The Lasso imputation also outperforms Amelia on these variables, but the unpenalized regression imputation has mixed effects. Interestingly, mean imputation performs the best for GPA and Grit, and we saw a similar performance on Material Hardship using mean imputation, Amelia, and linear regression, but Lasso was significantly worse than the former approaches. Overall, even simple mean imputation performed better than using Amelia on this dataset.

The approach we used comes with a number of assumptions:

  1. We assume that the best predictors of any given variable already exist in the Fragile Families dataset, and do not need significant processing. This is not an unreasonable assumption, as many variables in the dataset are collected across different waves, thus there may be predictable relationships between each wave.
  2. Our tests above assume a  linear relationship between predictor variables and the variable we impute, although our code has an option to also take into account polynomial effects (the ‘degree’ option available when using method=’lasso’).
  3. To get complete predictions for all 4000 cases using the regression models, we needed to first impute means of the covariates used for the imputation. In other words, in order to fill in missing data, we paradoxically needed to first fill in missing data. FIML is one solution to this challenge, and we hope to see this make its way into predictive modelling approaches in languages like R or Python.

Our pipeline

We modularized our work into two separate repositories, following the division of labor described above.

For general data processing, ffc-data-processing, which

  1. Works from the background.dta Stata file to extract covariate information.
  2. Provides helper functions for relatively fast data transformation.

For missing data imputation, FFCRegressionImputation, which

  1. Prepares the raw background.csv data and performs a logical imputation of age-related variables as we describe above.
  2. Constructs a (correlation) matrix of strengths of relationships between a set of variables.
  3. Uses the matrix to perform a regression-based prediction to impute the likely value of a missing entry.

For a technical overview of how these two bodies of code integrate with each other, check out the integration vignette. The vignette is an RMarkdown file which can be run as-is or freely modified.

The code in the vignette subsets to constructed variables, identifies those variables as either categorical or continuous, and then only imputes missing values for the continuous variables, using regression-based imputation. We chose to restrict the variables imputed for illustrative purposes, and to improve the runtime of the vignette. Users of the code can and should employ some sort of imputation strategy—regression-based or otherwise—for the categorical variables before incorporating the covariates into a predictive model.

Reflections

What seemed at the beginning to be a straightforward precursor to building predictive models turned out to have complexities and challenges of its own!

From our collaboration with others, it emerged that researchers from different fields perceive data problems very differently. A problem that might not seem important to a machine-learning researcher might strike a survey methodologist as critical to address. This kind of cross-disciplinary communication about expectations and challenges was productive and eye-opening.

In addition, the three of us came into this project with very different skillsets. We settled on R as a lingua franca, but drew on a much broader set of tools and techniques to tackle the problems posed by the Fragile Families Challenge. We would encourage researchers to explore all the programming tools at their disposal, from Stata to Python and beyond.

Finally, linking everyone’s efforts together into a single working pipeline that can be run end-to-end was a significant step by itself. Even with close communication, it took a great deal of creativity as well as clarity about desired inputs and outputs.

We hope that other participants in the Fragile Families Challenge find our tools and recommendations useful. We look forward to seeing how you can build on them!

Metadata about variables

Uncategorized No comments

We are happy to announce that Challenge participant Connor Gilroy, a Ph.D. student in Sociology at the University of Washington, has created a new resource that should make working the Challenge data more efficient. More specifically, he created a csv file that identifies each variable in the Challenge data file as either categorical, continuous, or unknown. Connor has also open sourced the code that he used to create the csv file. We’ve had many requests for such a file, and Connor is happy to share his work with everyone! If you want to check and improve Connor’s work, please consult the official Fragile Families and Child Wellbeing Study documentation.

Connor’s resource is part of a tradition during the Challenge whereby people have open sourced resources to make the Challenge easier for others. Other resources include:

If you have something that you’d like to open source, please let us know.

Finally, Connor work was part of a larger team project at the Summer Institute in Computational Social Science to build a full data processing pipeline for the Fragile Families Challenge. Stay tuned for that blog post on Tuesday, July 18!

Call for papers, special issue of Socius about the Fragile Families Challenge

Uncategorized No comments

Socius Call for Papers
Special issue on the Fragile Families Challenge
Guest editors: Matthew J. Salganik and Sara McLanahan

Socius, an open access journal published by the American Sociological Association, will publish a special issue on the predictive modeling phase of the Fragile Families Challenge. All participants in the Fragile Families Challenge are invited to submit a manuscript to this special issue.

A strong manuscript for the special issue will describe the process of creating a submission to the Challenge and will describe what was learned during that process. For example, a strong manuscript will describe the different approaches that were considered for data preprocessing, variable selection, missing data, model selection, and any other steps involved in creating the final submission to the Challenge. Further, a strong manuscript will also describe how the authors decided among the many possible approaches. Finally, some manuscripts may seek to draw more general lessons about social inequality, families, the common task method, social science, data science, or computational social science. Manuscript should be written in a style that is accessible to a general scientific audience.

The editors of the special issue may also consider other types of manuscripts that are consistent with the scientific goals of the Fragile Families Challenge. If you are considering submission a manuscript different from what is described above, please contact the editors of the special issue at fragilefamilieschallenge@gmail.com before submitting your manuscript.

All papers will be peer reviewed, and publication is not guaranteed. However, there is no limit on the number of articles that will be accepted in the special issue. All published papers must abide by the terms and conditions of the Fragile Families Challenge, and must be accompanied by open source code and a data file containing predictions.

Submissions for the special issue must be received through the Socius online submission platform by Sunday, October 1, 2017 Monday, October 16 at 11:59pm ET. If you have any questions about the special issue, please email fragilefamilieschallenge@gmail.com.

FAQ:

  • Do I need to describe an approach to predicting all six outcome variables in order to submit to the special issue?
  • No. We will happily consider papers that focus on one specific outcome variable.

  • Do I need to have a low mean-squared error in order for my paper to be published?
  • No. Predictive performance in the held-out dataset is only part of what we will consider. For example, a paper that clearly shows that many common strategies were not very effective would be considered a valuable contribution.

  • What if I can’t afford the Article Processing Charge?
  • Socius, like most open access journals, has an Article Processing Charge. This charge is required to keep Socius running, and it is in line with the charges at other open access journals. However, we strongly believe that the Article Processing Charge should not be a barrier to scientific participation. Therefore, the Fragile Families Challenge project will pay the Article Processing Charge for all accepted articles submitted by everyone except for tenure-track (or equivalent) faculty working in universities in OECD countries. In other words, we will cover the Article Processing Charge for undergraduates, graduate students, post-docs, and people working outside of universities. Further, we will pay the Article Processing Charge for all tenure-track (or equivalent) faculty working in universities outside the OECD.

    If for any reason you think that the Article Processing Charge may be a barrier to your participation, please send us an email and we will try to find a solution: fragilefamilieschallenge@gmail.com.

  • How will you decide what manuscripts to accept for publication?
  • Articles in Socius are judged by four criteria: Accuracy, Novelty, Interest, and Presentation. In the case of this special issue, these criteria will be judged by the editors of the special issue, with feedback from reviewers and the editors of Socius. For the purposes of this special issue, here is how these criteria will be interpreted:

    • Accuracy: The key question is whether this analysis was conducted appropriately and accurately. Were the techniques used in the manuscript performed and interpreted correctly? Do the claims in the manuscript match the evidence provided?
    • Novelty: The key question is whether the manuscript will be novel to some social scientists or some data scientists. Because projects like the Fragile Families Challenge are not yet common, we expect that most submitted manuscripts will be somewhat novel.
    • Interest: The key question for the editors is whether the manuscript will be interesting to some social scientists or some data scientists. Will some people want to read this paper? Does it advance understanding of the Fragile Families Challenge and related intellectual domains?
    • Presentation: The key question is whether this manuscript communicates effectively to a diverse audience of social scientist and data scientists. We will also assess whether the figures and tables are presented clearly and whether the manuscript makes appropriate use of the opportunity for supporting online information. Because these manuscripts will be short, we expect that the supporting online information will play a key role.

  • Who is the audience for these papers?
  • All papers should be written for a general scientific audience that will include both social scientists and data scientists (broadly defined). In other words, when writing your paper you should imagine an audience similar to the audience at journals such as Science and Proceedings of the National Academies of Sciences (PNAS). We would recommend reading some articles from these journals to get a sense of this style. Manuscripts that use excessive jargon from a specific field will be asked to make revisions.

    Manuscripts should follow the length guidelines of a Report published in Science: 2,500 words, with up to 4 figures or tables. Additional materials should be included in supporting online materials. We will consider articles that deviate from these guidelines in some situations. Other aspects of the manuscript format will follow standard Socius rules.

  • Should we describe the Fragile Families Challenge in our paper?
  • No. There is no need to describe the Challenge in your paper. The special issue will have an introductory article describing the Challenge and data. You should assume that your readers will already have this background information.

  • Will the articles go through peer review?
  • Absolutely. All manuscripts will be reviewed by at least two people. Possible reviewers include: members of the board of the Fragile Families Challenge, qualified participants in the Challenge, members of the general reviewer pool at Socius, and other qualified researchers.

  • What are the requirements for the open source code?
  • The code must take the Fragile Families Challenge data files as an input and produce (1) all the figures and tables in your manuscript and supporting online materials and (2) your final predictions. The code can be written in any language (e.g., R, stata, Python). The code should be released under the MIT license, but we will consider other permissive licenses in special situations.

  • How long will the review process take?
  • We don’t know exactly, but we are excited about having these results in the scientific literature as quickly as possible. Therefore, we will work as quickly as possible while maintaining the quality standards of the Fragile Families Challenge and Socius.

  • Will I have access to the holdout data when writing my paper? (added July 20, 2017)
  • No, but we will allow you to request scores for your models on the holdout as described in this blog post.

  • Will I have access to the Challenge data when writing my paper? (added July 27, 2017)
  • Yes. If you will submit to the Special Issue you can continue to use the Challenge data until the Special Issue is published. If you are not submitting to the Special Issue, then you should delete the Challenge data file on August 1. Finally, participants who want to continue to do non-Challenge related research with the Fragile Families and Child Wellbeing Study can, at any time, apply for access to the core Fragile Families data by following the instructions here: http://www.fragilefamilies.princeton.edu/documentation.

  • What if I want to submit to the special issue but I can’t exactly reproduce my submission to the Challenge? (added September 23, 2017)
  • Everyone in the Challenge was supposed to uploaded their code. But there are several reasons why they might not be able to use their code to reproduce their submission such as forgetting to set their seed or changes to the packages that were used in the submission (if you are interested, here are some general tips for promoting reproducibility Sandve et al (2013) “Ten Simple Rules for Reproducible Computational Research.”)

    If there is a tension between making your paper reproducible and making it match the submission to the Challenge exactly, you should opt to make your paper reproducible. If the code and predictions that you submit with your paper don’t exactly match what you submitted to the Challenge, you should include a note in your supporting online material explaining these differences and why they occurred. If this note will require addition information from us—such as the score of your reproducible results in the leaderboard data—we will provide it to you. We are happy to help you with these issues on a case-by-case basis.

  • I have another question, how can I ask it?
  • Send us an email: fragilefamilieschallenge@gmail.com.

getting started workshop, Princeton and livestream

Uncategorized No comments

We will be hosting a getting started workshop at Princeton on Friday, June 23rd from 10:30am to 4pm. This workshop will also be livestreamed at this link so even if you can’t make it to Princeton you can still participate.

During the workshop we will

  • Provide a 45 minute introduction to the Challenge and the data (slides)
  • Provide food and a friendly collaborative environment
  • Work together to produce your first submission

In addition to people just getting started, we think the workshop will be helpful for people who have already been working on the Challenge and who want to improve their submission. We will be there to answer questions both in person and through Google Hangouts during the entire event.

Logistics:

  • When: Friday, June 23rd from 10:30 to 4pm ET
  • Where: Julis Romo Rabinowitz Building, Room 399 and streaming here
  • RSVP: If you have not already applied to the Challenge, please mention the getting started workshop in your application. If you have already applied, please let us know that you plan to attend (fragilefamilieschallenge@gmail.com). We are going to provide lunch for all participants, and we need to know how much food to order.
  • This getting started workshop will be a part of the Summer Institute for Computational Social Science.

Using .dta files in R

Uncategorized 2 comments
featured image

We’ve just released the Fragile Families Challenge data in .dta format, which means the files now include metadata that was not available in the .csv files that we initially released. The .dta format is native to Stata, and you might prefer to use R. So, in this post, I’ll give some pointers to getting up and running with the .dta file in R. If you have questions—and suggestions—please feel free to post them at the bottom of this post.

There are many ways to read .dta files into R. In this post I’ll use haven because it is part of the tidyverse.

Here’s how you can read in the .dta files (and I’ll read in the .csv file too so that we can compare them):

library(tidyverse)
library(haven)
ffc.stata <- read_dta(file = "background.dta")
ffc.csv <- read_csv(file = "background.csv")

One you start working with ffc.stata, one thing you will notice is that many columns are of type labelled, which is not common in R. To convert labelled to factors, use as_factor (not as.factor). For more on labelled and as_factors, see the documentation of haven.

Another thing you will notice is that some of the missing data codes from the Stata file don’t get converted to NA. For example, consider the variable "m1b9b11" for the person with challengeID 1104. This is a missing value that should be NA. This gets parsed correctly in the csv files but not the Stata file.

is.na(ffc.stata[(ffc.stata$challengeid==1104), "m1b9b11"])
is.na(ffc.csv[(ffc.csv$challengeID==1104), "m1b9b11"])

If you have questions---and suggestions---about working with .dta files in R, please feel free to post them below.

Notes:

  • The read_dta function in haven is a wrapper around the ReadStat C library.
  • The read.dta function in the foreign library was popular in the past, but that function is now frozen and will not support anything after Stata 12.
  • Another way to read .dta files into R is the readstata13 package, which, despite what the name suggests, can read Stata 13 and Stata 14 files.

Machine-Readable Fragile Families Codebook

Uncategorized No comments

The Fragile Families and Child Wellbeing study has been running for more than 15 years. As such, it has produced an incredibly rich and complex set of documentation and codebooks. Much of this documentation was designed to be “human readable,” but, over the course of the Fragile Families Challenge, we have had several requests for a more “machine-readable” version of the documentation. Therefore, we are happy to announce that Greg Gundersen, a student in Princeton’s COS 424 (Barbara Engelhardt’s undergraduate machine learning class), has created a machine-readable version of the Fragile Families codebook in the form of a web API. We believe that this new form of documentation will make it possible for researchers to work with the data in unexpected and exciting ways.

There are three ways that you can interact with the documentation through this API.

First, you can search for words inside of question description field. For example, imagine that you are looking for all the questions that include the word “evicted”. You can find them by visiting this URL:
https://codalab.fragilefamilieschallenge.org/f/api/codebook/?q=evicted

Just put your search term after the “q” in the above URL.

The second main way that you can interact with the new documentation is by looking up the question data associated with a variable name. For example, want to know what is “cm2relf”? Just visit:
https://codalab.fragilefamilieschallenge.org/f/api/codebook/cm2relf

Finally, if you just want all of the questionnaire data, visit this URL:
https://codalab.fragilefamilieschallenge.org/f/api/codebook/

A main benefit of a web API is that researchers can now interact with the codebooks programmatically through URLs. For example, here is a snippet of Python 2 code that fetches the data for question “cm2mint'”:

>>> import urllib2
>>> import json
>>> response = urllib2.urlopen('https://codalab.fragilefamilieschallenge.org/f/api/codebook/cm2mint')
>>> data = json.load(response)
>>> data
[{u'source file': u'http://fragilefamilies.princeton.edu/sites/fragilefamilies/files/ff_mom_cb1.txt', u'code': u'cm2mint', u'description': u'Constructed - Was mother interviewed at 1-year follow-up?', u'missing': u'0/4898', u'label': u'YESNO8_mw2', u'range': [0, 1], u'unique values': 2, u'units': u'1', u'type': u'numeric (byte)'}]

We are very grateful to Greg for creating this new documentation and sharing it with everyone.

Notes:

  • Greg has open sourced all his code, so you can help us improve the codebook. For example, someone could write a nice front-end so that you can do more than just interact via the url.
  • The machine-readable documentation should include the following fields: description, source file, type, label, range, units, unique values, missing. If you develop code that can parse some of the missing fields, please let us know, and we can integrate your work into API.
  • The machine-readable documentation includes all the documentation that was in text files (e.g., http://fragilefamilies.princeton.edu/sites/fragilefamilies/files/ff_dad_cb5.txt). It does not include documentation that was in pdf format (e.g., http://fragilefamilies.princeton.edu/sites/fragilefamilies/files/ff_hv_cb5.pdf).
  • When you visit these urls, what gets returned is in JSON format, and different browsers render this JSON differently.
  • If there is a discrepancy between the machine-readable codebook and the traditional codebook, please let us know.
  • To deploy this service we used Flask, which is an open source project. Thank you to the Flask community.

Progress prizes

Uncategorized 11 comments
featured image

We were glad to receive many submissions in time for the progress prizes! As described below, we have downloaded these submissions and look forward to evaluating them and determining the best submissions at the end of the Challenge.

We are excited to announce that progress prizes will be given based on the best-performing models on Wednesday May 10, 2017 at 2pm Eastern time. We will not announce the winners, however, until after the Challenge is complete.

Here’s how it will work. On May 10, 2017 at 2pm Eastern time, we will download all the submissions on the leaderboard. However, we will not calculate which submission has the lowest error on the held-out test data until after the Challenge is complete. The reason for this delay is that we don’t want to reveal any information at all about the held-out test data until after the Challenge is over.

From the submissions that we have received by May 10, 2017 at 2pm Eastern Time, we will pick the ones that have the lowest mean-squared error on the held-out test data for each of the six outcome variables. In other words, there will be one prize for the submission that performs best for grit, and there will be another prize for the submission that performs best for grade point average, and so on.

All prize winners will be invited to participate in the post-Challenge scientific workshop at Princeton University, and we will cover all travel expenses for invited participants. If the prize-winning submission is created by a team, we will cover all travel expenses for one representative from that team.

We look forward to seeing the submissions.

upload your contribution

Uncategorized No comments
featured image

This post will walk you through the steps to prepare your files for submission and upload them to the submission platform. The organizer of your group (i.e. your professor or TA) will provide a link to the submission platform.

1. Save your predictions as prediction.csv.

This file should be structured the same way as the “prediction.csv” file provided as part of your data bundle.

This file should have 4,242 rows: one for each observation in the test set.

We are asking you to make predictions for all 4,242 cases, which includes both the training cases from train.csv and the held-out test cases. We would prefer that you not simply copy these cases from train.csv to prediction.csv. Instead, please submit the predictions that come out of your model. This way, we can compare your performance on the training and test sets, to see whether those who fit closely to the training set perform more poorly on the test set (see our blog discussing overfitting). Your scores will be determined on the basis of test observations alone, so your predictions for the cases included in train.csv will not affect your score.
There are some observations that are truly missing: we do not have the true answer for these cases because respondents did not complete the interview or did not answer the question. This is true for both the training and the test sets. Your predictions for these cases will not affect your scores. We are asking you to make predictions for missing cases because it is possible that we will find those respondents sometime in the future and uncover the truth. It will be scientifically interesting to know how well the community model was able to predict these outcomes which even the survey staff did not know at the time of the Challenge.

This file should have 7 columns for the ID number and the 6 outcomes. They should be named:

challengeID, gpa, grit, materialHardship, eviction, layoff, jobTraining

The top of the file will look like this (numbers here are random). challengeID numbers can be in any order.


2. Save your code.

3. Create a narrative explanation of your study. This should be saved in a file called “narrative” and can be a text file, PDF, or Word document.

At the top of this narrative explanation, tell us your names of everyone on the team that produced the submission, or your name if you worked alone, in the format:

Homer Simpson,
homer@gmail.com

Marge Simpson,
msimpson@gmail.com

Then, tell us about how you developed the submission. This might include your process for preparing a the data for analysis, methods you used in the analysis, how you chose the submission you settled on, things you learned, etc.

4. Zip all the files together in one folder.

It is important that the files be zipped in a folder with no sub-directories. Instructions are different for Mac and windows.

On Mac, highlight all of the individual files.

Right click and choose “Compress 3 items”.

On Windows, highlight all of the individual files.

Right click and choose
Send to -> Compressed (zipped) folder

5. Upload the zipped folder to the submission site. The link to this will be provided to you by the organizers (i.e. your professor or TA) of your specific instance of the Fragile Families Challenge.

Click the “Participate” tab at the top, then the “Submit / View Results” tab on the left. Click the “Submit” button to upload your submission.

6. Wait for the platform to evaluate your submission.

Click “Refresh status” next to your latest submission to view its updated status and see results when they are ready. If successful, you will automatically be placed on the leaderboard when evaluation finishes.

build a model

Uncategorized No comments
featured image

Take our data and build models for the 6 child outcomes at age 15. Your model might draw on social science theories about variables that affect the outcomes. It might be a black-box machine learning algorithm that is hard to interpret but performs well. Perhaps your model is some entirely new combination no one has ever seen before!

The power of the Fragile Families Challenge comes from the heterogeneity of quality individual models we receive. By working together, we will harness the best of a range of modeling approaches. Be creative and show us how well your model can perform!

There are missing values. What do I do?

See our blog post on missing data.

What if I have several ideas?

You can try them all and then choose the best one! Our submission platform allows you to upload up to 10 submissions per day. Submissions will instantly be scored, and your most recent submission will be placed on the leaderboard. If you have several ideas, we suggest you upload them each individually and then upload a final submission based on the results of the individual submissions.

What if I don’t have time to make 6 models?

You can make predictions for whichever outcome interests you. To upload a submission with the appropriate file size, make a simple numeric guess for the rest of the outcomes. For instance, you might develop a careful model for grit, and then guess the mean of the training values for all of the remaining five observations. This would still allow you to upload 6 sets of predictions to the scoring function.

Apply to participate

Uncategorized No comments

The Fragile Families Challenge is now closed. We are no longer accepting applications!


What will happen after I apply?

We will review your application and be in touch by e-mail. This will likely take 2-3 business days. If we invite you to participate, you will be asked to sign a data protection agreement. Ultimately, each participant will be given a zipped folder which consolidates all of the relevant pieces of the larger Fragile Families and Child Wellbeing Study in three .csv files.

background.csv contains 4,242 rows (one per child) and 12,943 columns:

  • challengeID: A unique numeric identifier for each child.
  • 12,942 background variables asked from birth to age 9, which you may use in building your model.

train.csv contains 2,121 rows (one per child in the training set) and 7 columns:

  • challengeID: A unique numeric identifier for each child.
  • Six outcome variables (each variable name links to a blog post about that variable)
    1. Continuous variables: grit, gpa, materialHardship
    2. Binary variables: eviction, layoff, jobTraining

prediction.csv contains 4,242 rows and 7 columns:

  • challengeID: A unique numeric identifier for each child.
  • Six outcome variables, as in train.csv. These are filled with the mean value in the training set. This file is provided as a skeleton for your submission; you will submit a file in exactly this form but with your predictions for all 4,242 children included.

Understanding the background variables

To use the data, it may be useful to know something about what each variable (column) represents. Full documentation is available here, but this blog post distills the key points.

Waves and child ages

The background variables were collected in 5 waves.

  • Wave 1: Collected in the hospital at the child’s birth.
  • Wave 2: Collected at approximately child age 1
  • Wave 3: Collected at approximately child age 3
  • Wave 4: Collected at approximately child age 5
  • Wave 5: Collected at approximately child age 9

Note that wave numbers are not the same as child ages. The variable names and survey documentation are organized by wave number.

Variable naming conventions

Predictor variables are identified by a prefix and a question number. Prefixes the survey in which a question was collected. This is useful because the documentation is organized by survey. For instance the variable m1a4 refers to the mother interview in wave 1, question  a4.

  1. The prefix c in front of any variable indicates variables constructed from other responses. For instance, cm4b_age is constructed from the mother wave 4 interview, and captures the child’s age (baby’s age).
  2. m1, m2, m3, m4, m5: Questions asked of the child’s mother in wave 1 through wave 5.
  3. f1,...,f5: Questions asked of the child's father in wave 1 through wave 5
  4. hv3, hv4, hv5: Questions asked in the home visit in waves 3, 4, and 5.
  5. p5: Questions asked of the primary caregiver in wave 5.
  6. k5: Questions asked of the child (kid) in wave 5
  7. ffcc: Questions asked in various child care provider surveys in wave 3
  8. kind: Questions asked of the kindergarten teacher
  9. t5: Questions asked of the teacher in wave 5.

Ready to work with the data?

See our posts on building a model and working with missing data.