We were excited to release the holdout scores and announce prize winners for the Fragile Families Challenge. Our guess is that some people were pleasantly surprised by their scores and that some people were disappointed. In this post, we provide more information about how we constructed the training, leaderboard, and holdout sets, and some advice for thinking about your score. Also, if you plan to submit to the special issue of Socius—and you should—you can request scores for more than just your final submission.
Constructing the training, leaderboard, and holdout set
In order to understand your score, it is helpful to know a bit more about how we constructed the training, leaderboard, and holdout sets. We split the data into three sets: 4/8 training, 1/8 leaderboard, and 3/8 holdout.
In order to make each dataset as similar as possible, we selected them using a form of systematic sampling. We sorted observations by city of birth, mother’s relationship with the father at birth (cm1relf), mother’s race (cm1ethrace), whether at least 1 outcome is available at age 15, and the outcomes at age 15 (in this order): eviction, layoff of a caregiver, job training of a caregiver, GPA, grit, and material hardship. Once observations were sorted, we moved down the list in groups of 8 observations at a time and, for each group, randomly selected 4 observations to be in the training set, 1 to be in the leaderboard set, and 3 to be in the holdout set. This systematic sampling helped reduce the chance of us getting a “bad draw” whereby the datasets would differ substantially due to random chance.
All three datasets—training, leaderboard, holdout—include cases for which no age 15 outcomes have been collected yet. We decided to include these cases because data might be collected from them in the future and for some methodological research it might be interesting to compare predictions even if the truth is not known.
For the cases with no outcome data in the leaderboard set—but not the training and holdout sets—we added random imputed outcome data. We did this by randomly sampling outcomes with replacement from the observed outcomes in the leaderboard set. For example, the leaderboard included 304 observed cases for GPA and 226 missing cases imputed by random sampling with replacement from the observed cases.
Randomly imputing outcome data is a bit unusual. Our main reason for setting up the leaderboard this way was to develop a method for assessing model overfitting without opening the holdout set. In scientific challenges like the Fragile Families Challenge, participants can continuously improve their leaderboard scores over time, providing the appearance of real progress in constructing a good model. But, when assessed with the holdout set, that progress turns out to be an illusion: the final score is much worse than expected. This scenario is what happens when participants overfit their models to the leaderboard data. Because of this property, the leaderboard is a bad measure of progress: it misleads participants about the quality of their models. So, when calculating leaderboard score we used both real outcome data and randomly imputed outcome data. The imputed subset is randomly drawn, which means that score improvement on those observations over time is a clear indicator of overfitting to the leaderboard set. By disaggregating leaderboard scores into a real data score and an imputed data score behind the scenes, we were able to model how well participant submissions would generalize without looking at the holdout set.
If you would like to learn more about the problems with leaderboard scores, Moritz Hardt, a member of our Board of Advisors, has a paper on this problem: http://proceedings.mlr.press/v37/blum15.html.
Interpreting your score on the holdout set
You might be pleasantly surprised that your score on the holdout set was better than your score on the leaderboard set, or you might be disappointed that it was worse. Here are a few reasons that they might be different:
Overfitting the leaderboard: One reason that your performance might be worse on the holdout set is overfitting to the leaderboard. If you made many submissions and your submissions seemed to be improving, this might not actually be real progress. We had an earlier post on how the leaderboard can be misleading. Now that the first stage of the Challenge is complete, when you request scores on the holdout set, we will send you a graph of your performance over time on the real outcome data in the leaderboard as well as your performance on the imputed outcome data in the leaderboard. If your performance seems to be improving over time on the imputed outcome data, that is a sign that you have been overfitting to the leaderboard.
For example, consider these two case where the red line shows performance on the imputed leaderboard data and the blue line shows performance on the real leaderboard data.
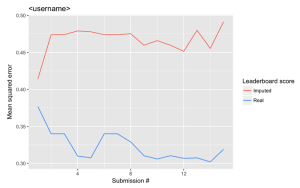
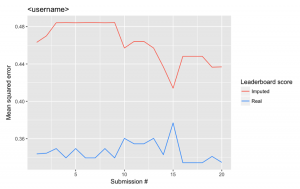
In the first case, the performance on the real data improved (remember lower is better) and performance on the imputed data did not improve. In the second case, however, performance on the imputed data improves quite a bit, while performance on the real data remains relatively static. In this case, we suspect overfitting to the leaderboard, and we suspect that this person will perform worse on the holdout set than the leaderboard set.
Noisy leaderboard signal: One reason that your score might be better on the holdout set is that the leaderboard set included the randomly imputed outcome data. Your predictions for these cases were probably not very good, and there are no randomly imputed outcome cases in the holdout set (cases with no outcome data in the holdout set are ignored).
Random variation: One reason that your score on the holdout set could be higher or lower is that there are not a huge number of cases in the leaderboard set (530 people) or the holdout set (1,591 people). Also, of these roughly one third are missing outcome data. With this few cases, you should expect that your score will vary some from dataset to dataset.
Conclusion
We hope that this background information about the construction of the training, leaderboard, and holdout sets helps you understand your score. If you have any more questions, please let us know.