GPA measures academic achievement.
We want to know:
- What helps disadvantaged children to beat the odds and succeed academically?
- What derails children so that they perform unexpectedly poorly?
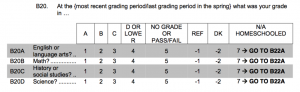
Survey question
How we cleaned the data
Our measure of GPA is self-reported by the child at approximately age 15. We marked as NA the GPAs of children who were not interviewed, reported no grade, refused to answer, did not know, or were homeschooled, for any of the four subjects. For children with valid answers, we averaged the responses for all four subjects, then subtracted this number from 5 to produce an estimate of child GPA ranging from 1 to 4. In our re-coded variable, a GPA of 4.0 indicates that the child reported straight As, while a GPA of 1.0 indicates that the child reported getting all grades of D or lower.
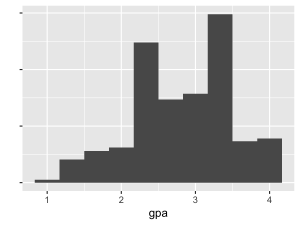
Distribution in the training set
Scientific motivation
Helping kids “beat the odds” academically is a fundamental goal of education research; academic success can be the key to breaking the cycle of poverty. Free public education is often referred to as a great equalizer, yet children who grow up in disadvantaged families consistently underperform their more affluent peers on average.
However, the average is not the whole story. Some kids do well despite being expected to do poorly. In fact, the amount of unexplained variation in educational achievement is enormous: social science models typically have R-squared values of 0.2 or less [this is based on our informal experience with the literature, not a systematic search]. The poor predictive performance of social science models of educational attainment has long been known. In the now-classic 1972 book Inequality: A Reassessment of the Effect of Family and Schooling in America, Harvard social scientist Christopher Jencks argued that random chance played a larger role than measured family background characteristics in determining socioeconomic outcomes.
While social scientists have learned some about what helps children succeed academically in the decades since 1972, a huge proportion of the variance remains buried in the error term of regression models. Is this term truly random chance, or is there “dark matter” out there in the form of unmeasured but important variables that help some kids to beat the odds?
By submitting a model for GPA at age 15, you help us in our quest to find this dark matter. Based on our collaborative model combining all of the individual submissions, we will identify our best guess as a scientific community about how children are expected to perform at age 15. Then, we will identify a subset of children performing much better and worse than expected. We will interview these children to answer the question: what unmeasured variables are common to the kids who are beating the odds, which we do not observe among the children who are struggling unexpectedly?
When you participate, you help us target interviews at the children whose outcomes are least well explained by our measured variables. These children are best-positioned for exploratory qualitative research to uncover unmeasured but important factors. Interviews may help us learn how some kids beat the odds, these results may drive future deductive research to evaluate the causal effect of these unmeasured variables, and ultimately we hope that policymakers can intervene on the “dark matter” we find in order to improve the lives of other disadvantaged children in the future.
Add your comment