Month September 2017

Month September 2017

Correction to prize winners

Uncategorized No comments

When newspapers have to correct a published article, they issue a correction that notes the errors in the prior version and how they have been corrected. Following this logic, this blog post explains a correction we have made to the prize winners blog.

At the close of the Challenge, one team (MDRC) mistakenly believed that the submission deadline, listed as 6pm UTC on Codalab, was 6pm Eastern Time. After the close of the Challenge at 2pm, they were unable to upload their submission. They emailed us very soon after the 2pm deadline indicating that they had misunderstood. Our Board of Advisors reviewed the case carefully and decided to accept this submission. We made this decision before we opened the holdout data.

When we actually evaluated the submissions with the holdout data, we downloaded all final submissions from Codalab and neglected to add the e-mailed MDRC submission to the set. The team noticed they were not on the final scores page and emailed us to ask. A week after opening the holdout set, we added their submission to the set, re-evaluated all scores, and discovered that this team had achieved the best score in eviction and job training, two prizes we had already awarded to other teams.

In consultation with our Board of Advisors, we decided to do three things.

First, we updated the final prize winners to recognize MDRC.

Second, we recognized that this was an unusual situation. Other teams had rushed to the 2pm deadline and might have scored better with a few extra hours of work. For this reason, we decided to create a new category: special honorary prizes. If MDRC won for an outcome, the second-place team (i.e. the team that was in first place at the close of the Challenge at 2pm) would be awarded a special honorary prize.

Third, we updated the prize winners figure and score ranks to include MDRC along with all submissions previously included.

All prize winners (final, progress, innovation, foundational, and special honorary) are invited to an all-expense-paid trip to Princeton University to present their findings at the scientific workshop.

Prize winners

Uncategorized 1 comment

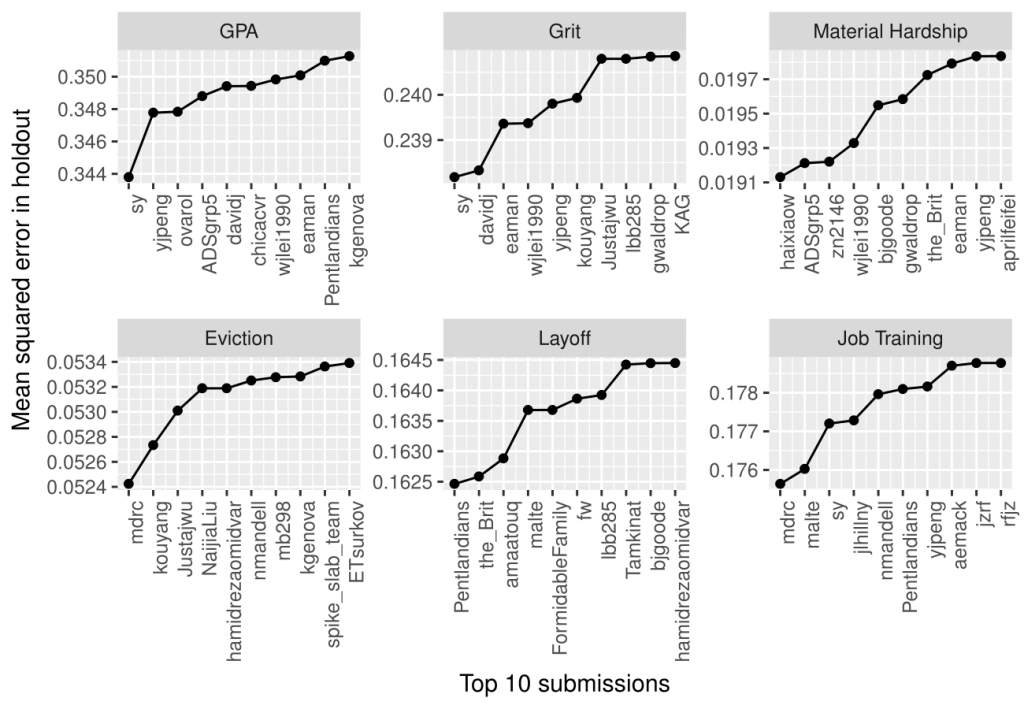
The Fragile Families Challenge received over 3,000 submissions from more 150 teams between the pilot launch on March 3, 2017, and the close on August 1, 2017. Each team’s final submission score on the holdout set is provided at this link. In this blog post, we are excited to announce the prize winners!

Final prizes

We are awarding prizes to the top-scoring submissions for each outcome, as measured by mean-squared error. The winners are:

  • GPA: sy (MIT Media Lab, Human Dynamics Group: Abdullah Almaatouq, Eaman Jahani, Daniel Rigobon, Yoshihiko Suhara, Khaled Al-Ghoneim, Abdulla Alhajri, Abdulaziz Alghunaim, Alfredo Morales-Guzman)
  • Grit: sy (MIT Media Lab, Human Dynamics Group: Abdullah Almaatouq, Eaman Jahani, Daniel Rigobon, Yoshihiko Suhara, Khaled Al-Ghoneim, Abdulla Alhajri, Abdulaziz Alghunaim, Alfredo Morales-Guzman)
  • Material hardship: haixiaow (Diana Stanescu, Erik H. Wang, and Soichiro Yamauchi; Ph.D. students, Department of Politics, Princeton University)
  • Eviction: MDRC (Kristin Porter, Richard Hendra, Tejomay Gadgil, Sarah Schell, and Meghan McCormick)
  • Layoff: Pentlandians (MIT Media Lab, Human Dynamics Group: Abdullah Almaatouq, Eaman Jahani, Daniel Rigobon, Yoshihiko Suhara, Khaled Al-Ghoneim, Abdulla Alhajri, Abdulaziz Alghunaim, Alfredo Morales-Guzman)
  • Job training: MDRC (Kristin Porter, Richard Hendra, Tejomay Gadgil, Sarah Schell, and Meghan McCormick)

Progress prizes

As promised, we are also awarding progress prizes to the top-scoring submissions for each outcome among submissions made by May 10, 2017 at 2pm Eastern Time. The following teams had the best submission as of this deadline are:

  • GPA: ovarol (Onur Varol, postdoctoral researcher at the Center for Complex Network Research, Northeastern University Networks Science Institute)
  • Grit: rap (Derek Aguiar, Postdoctoral Researcher, and Ji-Sung Kim, Undergraduate Student, Department of Computer Science, Princeton, NJ)
  • Material hardship: ADSgrp5
  • Eviction: kouyang (Karen Ouyang and Julia Wang, Princeton Class of 2017)
  • Layoff: the_Brit (Professor Stephen McKay, School of Social & Political Sciences, University of Lincoln, UK)
  • Job training: nmandell (Noah Mandell, Ph.D. candidate in plasma physics at Princeton University)

Foundational award

Greg Gunderson (ggunderson) produced machine-readable metadata that turned out to be very helpful for many participants. You can read more about the machine-readable metadata in our blog post on the topic. In addition to being useful to participants, this contribution was also inspirational for the Fragile Families team. They saw what Greg did and wanted to build on it. A team of about 8 people is now working to standardize aspects of the dataset and make more metadata available. Because Greg provided a useful tool for other participants, open-sourced all aspects of the tool, and inspired important changes that will make the larger Fragile Families project better, we are awarding him the foundational award.

Innovation awards

The Board of Advisers of the Fragile Families Challenge would also like to recognize several teams for particularly innovative contributions to the Challenge. For these prizes, we only considered teams that were not already recognized for one of the awards above. Originally, we planned to offer two prizes: “most novel approach using ideas from social science” and “most novel approach using ideas from data science.” Unfortunately, this proved very hard to judge because many of the best submissions combined data science and social science.

Therefore, after much deliberation and debate, we have decided to award two prizes to for innovation. These submissions each involved teams of people working collaboratively. Each team thought carefully about the raw data and cleaned variables manually to provide useful inputs to the algorithm, much as a social scientist typically would. Each team then implemented well-developed machine learning approaches to yield predictive models.

We are recognizing the following teams:

  • bjgoode (Brian J. Goode, Virginia Tech, acknowledging Dichelle Dyson and Samantha Dorn)
  • carnegien (Nicole Carnegie, Montana State University, and Jennifer Hill and James Wu, New York University)

We are encouraging these teams to prepare blog posts and manuscripts to explain their approaches more fully. To be clear, however, there were many, many innovative submissions, and we think that a lot of creative ideas were embedded in code and hard to extract from the short narrative explanations. We hope that all of you will get to read about these contributions and more in the special issue of Socius.

Special honorary prizes

As explained in our correction blog post, our Board of Advisors decided to accept a submission that arrived shortly after the deadline, because of confusing statements on our websites about the hour at which the Challenge closed. This team (mdrc) had the best score for two outcomes (eviction and job training) and was awarded the final prize for each of these outcomes. Because we recognize that this was an unusual situation, we are awarding special honorary prizes to the second-place teams for each of these outcomes.

  • Eviction: kouyang (Karen Ouyang and Julia Wang, Princeton Class of 2017)
  • Job training: malte (Malte Moeser, Ph.D. student, Department of Computer Science, Princeton University)

Conclusion

Thank you again to everyone that participated. We look forward to more exciting results to come in the next steps of the Fragile Families Challenge, and we hope you will join us for the scientific workshop (register here) at Princeton University on November 16-17!

Understanding your score on the holdout set

Uncategorized No comments

We were excited to release the holdout scores and announce prize winners for the Fragile Families Challenge. Our guess is that some people were pleasantly surprised by their scores and that some people were disappointed. In this post, we provide more information about how we constructed the training, leaderboard, and holdout sets, and some advice for thinking about your score. Also, if you plan to submit to the special issue of Socius—and you should—you can request scores for more than just your final submission.

Constructing the training, leaderboard, and holdout set

In order to understand your score, it is helpful to know a bit more about how we constructed the training, leaderboard, and holdout sets. We split the data into three sets: 4/8 training, 1/8 leaderboard, and 3/8 holdout.

In order to make each dataset as similar as possible, we selected them using a form of systematic sampling. We sorted observations by city of birth, mother’s relationship with the father at birth (cm1relf), mother’s race (cm1ethrace), whether at least 1 outcome is available at age 15, and the outcomes at age 15 (in this order): eviction, layoff of a caregiver, job training of a caregiver, GPA, grit, and material hardship. Once observations were sorted, we moved down the list in groups of 8 observations at a time and, for each group, randomly selected 4 observations to be in the training set, 1 to be in the leaderboard set, and 3 to be in the holdout set. This systematic sampling helped reduce the chance of us getting a “bad draw” whereby the datasets would differ substantially due to random chance.

All three datasets—training, leaderboard, holdout—include cases for which no age 15 outcomes have been collected yet. We decided to include these cases because data might be collected from them in the future and for some methodological research it might be interesting to compare predictions even if the truth is not known.

For the cases with no outcome data in the leaderboard set—but not the training and holdout sets—we added random imputed outcome data. We did this by randomly sampling outcomes with replacement from the observed outcomes in the leaderboard set. For example, the leaderboard included 304 observed cases for GPA and 226 missing cases imputed by random sampling with replacement from the observed cases.

Randomly imputing outcome data is a bit unusual. Our main reason for setting up the leaderboard this way was to develop a method for assessing model overfitting without opening the holdout set. In scientific challenges like the Fragile Families Challenge, participants can continuously improve their leaderboard scores over time, providing the appearance of real progress in constructing a good model. But, when assessed with the holdout set, that progress turns out to be an illusion: the final score is much worse than expected. This scenario is what happens when participants overfit their models to the leaderboard data. Because of this property, the leaderboard is a bad measure of progress: it misleads participants about the quality of their models. So, when calculating leaderboard score we used both real outcome data and randomly imputed outcome data. The imputed subset is randomly drawn, which means that score improvement on those observations over time is a clear indicator of overfitting to the leaderboard set. By disaggregating leaderboard scores into a real data score and an imputed data score behind the scenes, we were able to model how well participant submissions would generalize without looking at the holdout set.

If you would like to learn more about the problems with leaderboard scores, Moritz Hardt, a member of our Board of Advisors, has a paper on this problem: http://proceedings.mlr.press/v37/blum15.html.

Interpreting your score on the holdout set

You might be pleasantly surprised that your score on the holdout set was better than your score on the leaderboard set, or you might be disappointed that it was worse. Here are a few reasons that they might be different:

Overfitting the leaderboard: One reason that your performance might be worse on the holdout set is overfitting to the leaderboard. If you made many submissions and your submissions seemed to be improving, this might not actually be real progress. We had an earlier post on how the leaderboard can be misleading. Now that the first stage of the Challenge is complete, when you request scores on the holdout set, we will send you a graph of your performance over time on the real outcome data in the leaderboard as well as your performance on the imputed outcome data in the leaderboard. If your performance seems to be improving over time on the imputed outcome data, that is a sign that you have been overfitting to the leaderboard.

For example, consider these two case where the red line shows performance on the imputed leaderboard data and the blue line shows performance on the real leaderboard data.
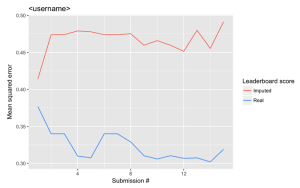
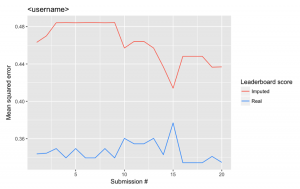
In the first case, the performance on the real data improved (remember lower is better) and performance on the imputed data did not improve. In the second case, however, performance on the imputed data improves quite a bit, while performance on the real data remains relatively static. In this case, we suspect overfitting to the leaderboard, and we suspect that this person will perform worse on the holdout set than the leaderboard set.

Noisy leaderboard signal: One reason that your score might be better on the holdout set is that the leaderboard set included the randomly imputed outcome data. Your predictions for these cases were probably not very good, and there are no randomly imputed outcome cases in the holdout set (cases with no outcome data in the holdout set are ignored).

Random variation: One reason that your score on the holdout set could be higher or lower is that there are not a huge number of cases in the leaderboard set (530 people) or the holdout set (1,591 people). Also, of these roughly one third are missing outcome data. With this few cases, you should expect that your score will vary some from dataset to dataset.

Conclusion

We hope that this background information about the construction of the training, leaderboard, and holdout sets helps you understand your score. If you have any more questions, please let us know.